People come up with all kinds of reasons not to buy stocks with strong momentum. Some of the most common reasons that I hear:
- Stocks with high momentum are risky
- Stocks with high momentum are overvalued
- Stocks with high momentum are susceptible to reversals
As for the first point, yes, buying stocks with high momentum is risky. So is buying stocks with weak momentum. As far as that goes, buying any stock is risky (stocks with good valuations, bad valuations, small cap, mid cap, large caps….) The stock market is a risky place. It can also be a very rewarding place.
As for the second point, yes, sometimes high momentum stocks have higher valuations than low momentum stocks. But not always. Also, it is not uncommon for stocks with high price momentum to far exceed earnings expectations and lo and behold it often turns out that maybe they really weren’t overvalued after all.
Finally, the concern about high momentum names being susceptible to reversals. There is truth to this. Momentum is a trend following strategy and all trends work great until they end. However, the key is whether or not enough money can be made while the trends are in place to make up for the amount of money that will be lost during changes in leadership.
To the data. The Ken French Data Library is a fantastic resource for testing the merits of different strategies as it includes performance for a variety of investment approaches (momentum, value, size, dividend yield…).
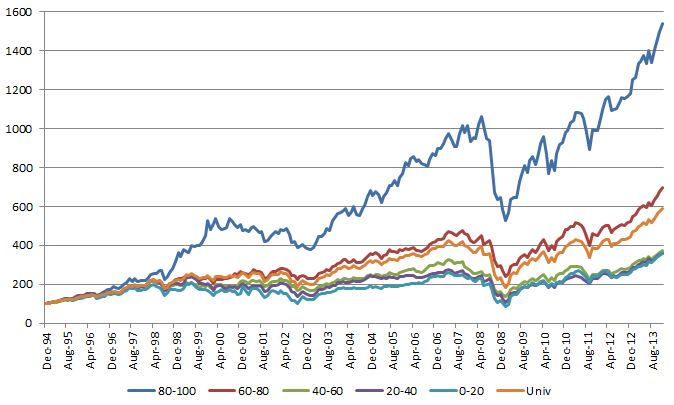
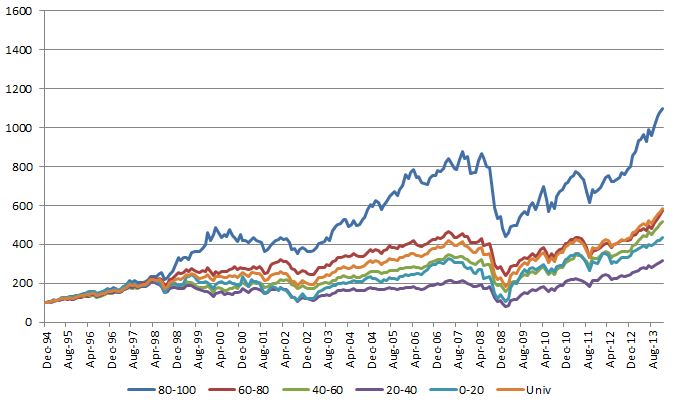
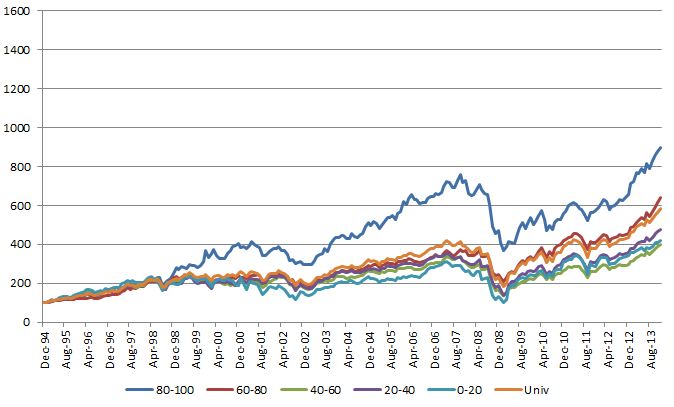
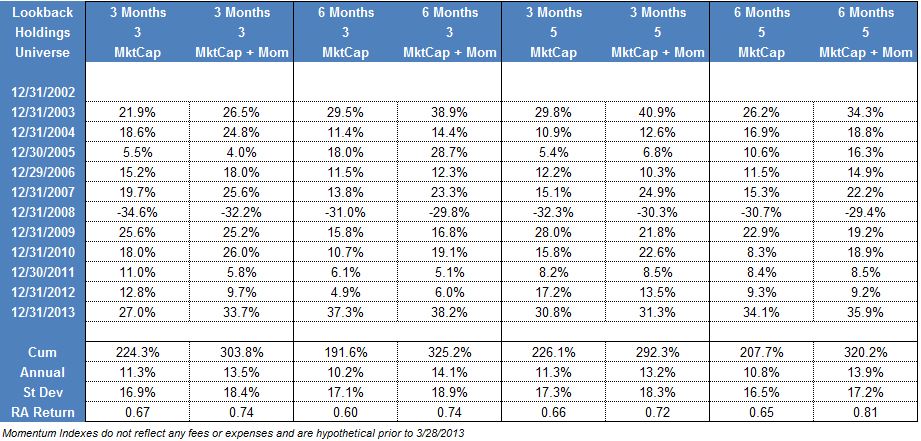
One of the ways that the Ken French Data Library segments their universe of U.S. mid and large cap stocks is by size and momentum. The results below show performance of three different portfolios. All three are from a strategy that invests in stocks in the top half of market capitalization from their investment universe. The “High” momentum portfolio is an equally-weighted portfolio of the stocks from the universe with the best momentum over the previous 12 months, the “Middle” momentum portfolio is an equally-weighted portfolio of stocks from the universe with moderate momentum (30-70th percentile) over the previous 12 months, and the “Bottom” momentum is an equally-weighted portfolio of stocks from the universe with the weakest momentum over the previous 12 months. All three portfolios were rebalanced monthly.

Returns are inclusive of dividends, but do not include any fees or transaction costs. *12/31/1926 – 9/30/2015
Over this nearly 89-year period of time, the High momentum portfolio had an annualized return of 15.08%, the Middle momentum portfolio had an annualized return of 10.46%, and the Bottom momentum portfolio had an annualized return of 4.56%.
Furthermore, the High momentum portfolio outperformed the Middle momentum portfolio in 86% of rolling 5-periods and outperformed the Bottom momentum portfolio in 94% of rolling 5-year periods over this period of time.
Bottom line: Buy the winners (and continue to hold them as long as they remain strong). It doesn’t work all the time, but it works a high percentage of the time. When it comes to choosing long-term investment strategies that can be the cornerstone for an asset allocation, momentum makes a compelling argument to be in the mix.
One final thought, I can’t tell you how often I see people make reference to the compelling returns of momentum over time and then say something like, “but whatever you do, never use it as a stand alone factor!” Still baffled by that one. Seems that it works just fine as a single factor. To be clear, I am not arguing that momentum should be the only factor in an entire allocation. We have frequently made the argument, along with others, that momentum and value strategies tend to be good complements. However, I see no reason why a single-factor momentum strategy can’t make up a meaningful portion of a client’s overall asset allocation.
The relative strength strategy is NOT a guarantee. There may be times where all investments and strategies are unfavorable and depreciate in value.