One of the benefits managing money in a systematic (i.e. rules-based) fashion is that we are able to apply a given set of investment rules to a historical data set in order to see how those rules worked over longer periods of time. In fact, a major reason that we introduced our rules-based relative strength portfolios to the market is because of the compelling results of such tests by us and by many others. Our family of Systematic Relative Strength separately managed accounts consists of a number of different strategies which focus on different asset classes. The first member of this family of Systematic Relative Strength portfolios was our Aggressive strategy which invests in 20-25 U.S. mid- and large-cap stocks with powerful relative strength characteristics.
Now that we have over five years worth of real returns, it is instructive to compare the actual gross returns of our Aggressive strategy to one of the more prominent publicly available relative strength models to see how it has stacked up.
One of the more prominent publicly-known relative strength models is maintained by Dr. Ken French at his online data library. French’s data library is valuable source of information for those who want to see the validity of rules-based models. French maintains models on a number of different investment factors, including a number of value and price momentum factors.
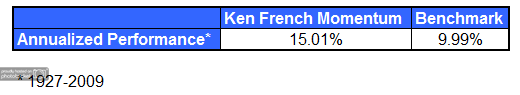
The table below shows the results of Dr. French’s Momentum Model which is constructed by taking stocks with the top third of market capitalization in his universe of stocks that trade on the NYSE, AMEX, and NASDAQ and the top third of price momentum (defined by trailing 12-month returns) out of the same universe. As shown in the table below, the public momentum model outperformed the benchmark by over 5% per year over the last 83 years. (The benchmark is an equally-weighted index of the stocks with the top third of market capitalization in the same investment universe.)
(Click to Enlarge)
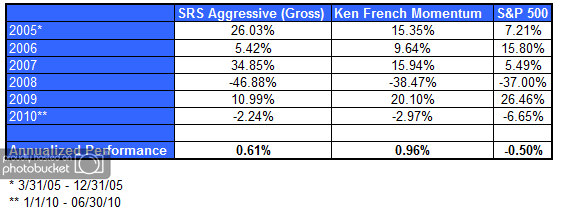
Although our own relative strength models are based on a proprietary relative strength factor, it is similar to Dr. French’s model in that it is designed to keep the portfolio fresh with stocks that have strong intermediate-term relative strength. If our model is working as anticipated, one would expect the returns to be similar to Dr. French’s momentum portfolio. And, in fact, that is exactly the case. There was only a difference in annualized performance of 35 basis points between the French Momentum Model and our own Aggressive portfolio over the last 5.25 years. In other words, the live returns of our Aggressive model are about in line with what we would expect after comparing it to a publicly-known method of constructing a relative strength model.
Our longer-term testing suggests that there may be performance advantages of our proprietary method over publicly-known methods for calculating relative strength. Nevertheless, the real key to outperformance over time is found in the consistent execution of relative strength models.
(Click to Enlarge)
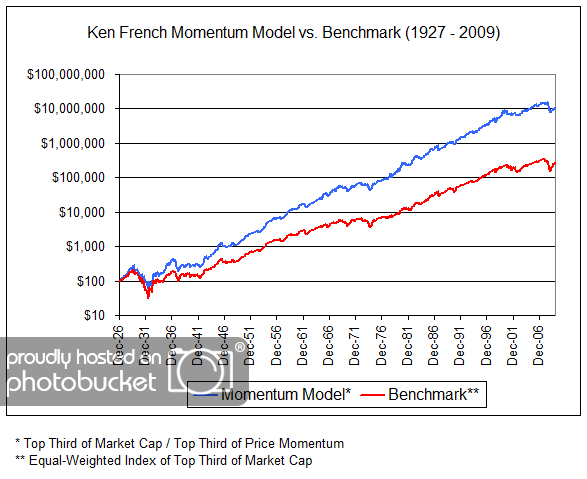
The amount of outperformance of relative strength strategies over the past 5.25 years has been modest compared to the longer-term average. However, a more detailed look at the historical returns of the Ken French Momentum Model reveal that relative strength tends to move in and out of favor as an investment factor. Relative strength strategies have plenty of short-term time periods where the returns are fairly average or even sub-par. However, over longer periods of time, relative strength has proven capable of delivering spectacular outperformance. Here’s a view of the longer-term performance of Dr. French’s momentum model.
(Click to Enlarge)
At first glance, it looks nice, but not earthshaking. However, it is a logarithmic chart scale, designed to equate percentage changes. For a mind-blowing perspective, look carefully at the terminal values of the line on the right hand side of the chart: less than $300,000 for the benchmark, but around $11 million dollars for the high relative strength portfolio. Now that’s a testament to the power of compounding!
In summary, after 5.25 years of managing live money in the Systematic Relative Strength Aggressive strategy we are right where we need to be and we look forward to capitalizing on what we expect to be the very fruitful rewards that have been earned by those who stick to the discipline for extended periods of time.
Click here to receive the brochure on our Systematic Relative strength portfolios. Click here for disclosures.
