Inherently Unstable

April 16, 2010

No, this is not a post on personality disorders.

Rather, it is a post on the inherently unstable nature of correlations between securities and between asset classes. This is important because the success of many of the approaches to portfolio management make the erroneous assumption that correlations are fairly stable over time. I was reminded just how false this belief is while reading The Leuthold Group‘s April Green Book in which they highlighted the rolling 10-year correlations in monthly percentage changes between the S&P; 500 and the 10-year bond yield. Does this look stable to you? Chart is shown by permission from The Leuthold Group.
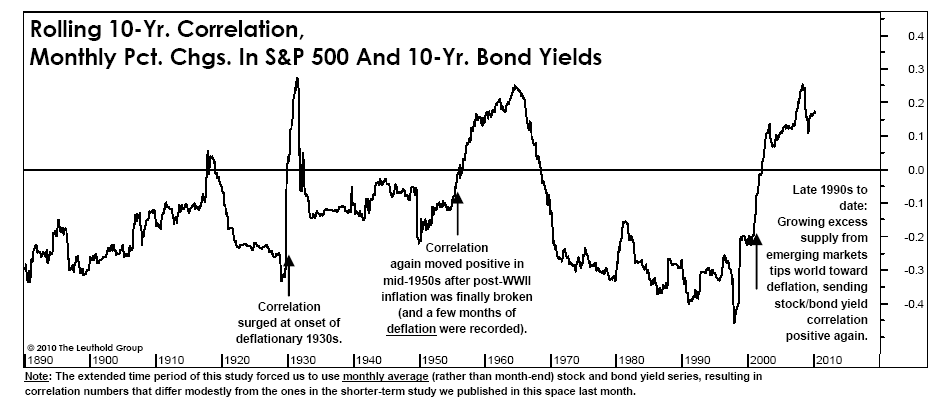
(Click to Enlarge)

If you are trying to use this data, would you conclude that higher bond yields are good for the stock market or bad? The answer is that the correlations are all over the map. In 2006, William J. Coaker II published The Volatility of Correlations in the FPA Journal. That paper details the changes in correlations between 15 different asset classes and the S&P; 500 over a 34-year time horizon. To give you a flavor for his conclusions, he pointed out that Real Estate’s rolling 5-year correlations to the S&P; 500 ranged from 0.17 to 0.75, and for Natural Resources the range was -0.34 to 0.49. History is conclusive – correlations are unstable.

This becomes a big problem for strategic asset allocation models that use historical data to calculate an average correlation between securities or asset classes over time. Those models use that stationary correlation as one of the key inputs into determining how the model should currently be allocated. That may well be of no help to you over the next five to ten years. Unstable correlations are also a major problem for “financial engineers” who use their impressive physics and computer programming abilities to identify historical relationships between securities. They may find patterns in the historical data that lead them to seek to exploit those same patterns in the future (i.e. LTCM in the 1990’s.) The problem is that the future is under no obligation to behave like the past.

Many of the quants are smart enough to recognize that unstable correlations are a major problem. The solution, which I have heard from several well-known quants, is to constantly be willing to reexamine your assumptions and to change the model on an ongoing basis. That logic may sound intelligent, but the reality is that many, if not most, of these quants will end up chasing their tail. Ultimately, they end up in the forecasting game. These quants are rightly worried about when their current model is going to blow up.

Relative strength relies on a different premise. The only historical pattern that must hold true for relative strength to be effective in the future is for long-term trends to exist. That is it. Real estate (insert any other asset class) and commodities (insert any other asset class) can be positively or negatively correlated in the future and relative strength models can do just fine either way. Relative strength models make zero assumptions about what the future should look like. Again, the only assumption that we make is that there will be longer-term trends in the future to capitalize on. Relative strength keeps the portfolio fresh with those securities that have been strong relative performers. It makes no assumptions about the length of time that a given security will remain in the portfolio. Sure, there will be choppy periods here and there where relative strength models do poorly, but there is no need (and it is counterproductive) to constantly tweak the model.

Ultimately, the difference between an adaptive relative strength model and most quant models is as different as a mule is from a horse. Both have four legs, but they are very different animals. One has a high probability of being an excellent performer in the future, while the other’s performance is a big unknown.

Posted by:


Why No One Pays Attention to Economists

April 16, 2010

This article from Time Magazine is priceless. Two econ professors are suggesting that young people use 2-1 leverage to buy stocks for their long time horizon retirement portfolios. Apparently their Monte Carlo simulation didn’t include all of the margin calls you would get during every drawdown. Long on IQ perhaps, but short on common sense.

Posted by:


Investing for Income

April 16, 2010

As the front end of the baby boomers hit retirement age, investing for income has become their mantra. Retirees are often sold terrible investments because of their known propensity to lunge at income the way a starving fish attacks a baited hook. But is investing for income desirable, or even possible? Let’s take a look at the income possibilities from bonds, stocks, and alternatives.

Bonds are boring and safe, and are usually the first place investors go for income–except that with current interest rates, there isn’t much income available. Most retirees can’t live on 2-year Treasury yields of 1.04%, and moving out to the 30-year Treasury at 4.72% brings with it a significant chance of getting hurt by inflation. Yields on junk bonds (euphemistically known as high-yield bonds) are higher, but that crosses over from investing for income to its less glamorous cousin, “reaching for yield.” Junk bonds might work for a while, as long as the economy is in recovery mode, but are probably not a long-term solution for a retiree. As the saying goes, “More money has been lost reaching for yield than at the point of a gun.”

Many investors have looked to the stock market for dividend yield. Doug Short has a nice piece on the disappearing yields in stocks on his excellent site. The chart below is taken from his article. Stock prices have been rising, but dividend yields have been going the other direction.

Click to enlarge. Source: dshort.com

The traditional high-dividend sectors for investors were always banks, oil stocks, utilities, and REITs. When stock prices plunged in 2008, many banks eliminated or severely slashed their dividends. Some REITs had the same problem. Oil stocks and utilities don’t have nearly the dividend yields they used to. All of the dividend cuts and reductions caused the high-yielding equities to do worse than the general market. (See the chart below for a comparison of the S&P; 500 to the Dow Jones Select Dividend Index ETF.)

Source: Yahoo! Finance

Alternatives range from MLPs (typically finite lives and unstable income streams) to all sorts of structured products. This morning someone sent me an offering flyer for a 12-year 8% CD, where the quarterly rate is based on the slope of the yield curve. 8% was the cap rate, but it could drop to 0% if the yield curve flattened out. I’m not sure Mrs. Jones is ready to speculate with derivatives.

All in all, it appears that the income investor has hit a rough patch and there seems to be no easy way out. I’m going to let you in on a secret that very few investors know: capital gains can be spent just as easily as dividends. Ok, that’s not really a secret at all, but many investors act like it is. They chase yield so they can spend the income, but really, total return is all that matters.

Segmentation, like the distinction investors often impose between income and principal, is a natural function of the mind. Many retirement planners have been using this human tendency to segment things by presenting a retirement income solution that consists of a number of buckets, a solution that is generally well-received by clients.

The first bucket is the liquidity bucket, where spending will be drawn from. The second bucket is the income bucket, which is typically put into some kind of fixed-income investment. The third bucket is the growth bucket. By segmenting the growth portion, the investor might be more willing to leave it alone as it gyrates with the market.

When there is a particularly good quarter or good year, the growth bucket can be trimmed back and the proceeds “deposited” into the liquidity bucket. Obviously, you could use any number of buckets depending on how finely you choose to segment the investment universe. The relative size and specific composition of each bucket would be determined by the client’s situation. Most often, all of this can be done within one account. The buckets are mental, but they help separate the investments and their specific purpose in the client’s mind.

When viewed in the context of buckets within a single account, it becomes quite apparent that total return is what counts. Investing for income may be a misnomer; investing for total return is the real deal.

Posted by:


Sector and Capitalization Performance

April 16, 2010

The chart below shows performance of US sectors and capitalizations over the trailing 12, 6, and 1 month(s). Relative strength strategies buy securities that have strong intermediate-term relative strength and hold them as long as they remain strong. Performance updated through 4/15/2010.

Posted by: