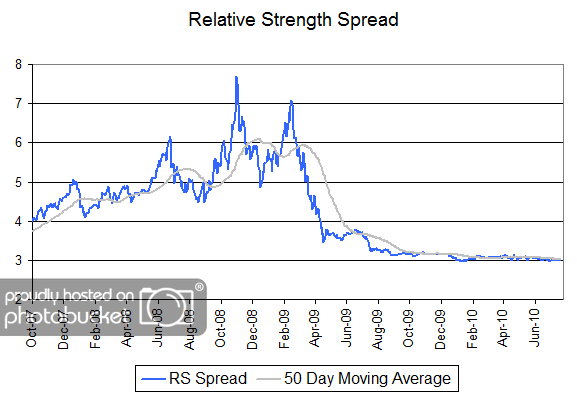
The chart below is the spread between the relative strength leaders and relative strength laggards (universe of mid and large cap stocks). When the chart is rising, relative strength leaders are performing better than relative strength laggards. As of 8/9/2010:
A longer term RS Spread is shown below.
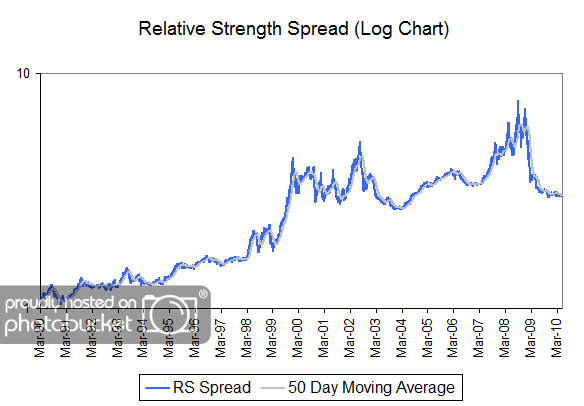
The RS Spread has risen (in fits and starts) over time as the high relative strength stocks have handily outperformed the relative strength laggards. The RS Spread has been relatively flat for the last year or so, after declining sharply in the first half of 2009. Can you identify other periods where the RS Spread had similar action to what we have seen over the last couple of years? What followed those periods? Perhaps, that will help provide insight into our optimism for relative strength strategies in the coming years.

[...] waiting game continues. The RS Spread has been flat since August 2009. As we have pointed out before, RS leaders have performed much better than RS laggards over time and we expect that trend to [...]