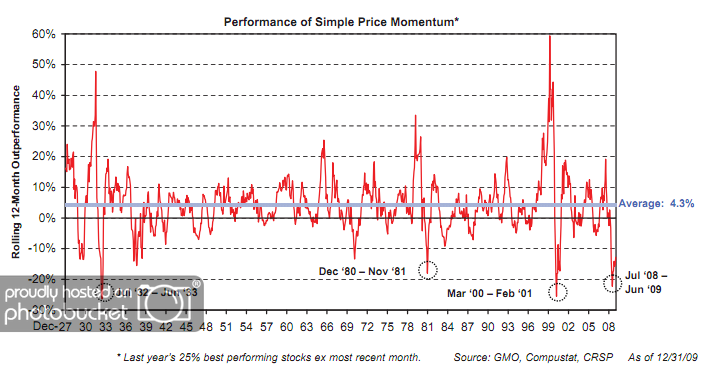
When discussing the long-term results of relative strength strategies, we often refer to the data found at the Ken French Data Library. Click here, here, and here for some of our past commentary on this data which highlights the magnitude and consistency of outperformance over time. A close study of the data reveals that a high percentage of rolling 5-year periods have been favorable for relative strength strategies. However, the data clearly shows that relative strength strategies periodically get put through the wringer! Nothing is perfect. One such period was June 2008-June 2009, as is shown in the chart below.
(Click to Enlarge)
As shown in the chart above, a simple relative strength strategy underperformed a cap-weighted benchmark by roughly 20% from June 2008 to June 2009. What was it about that environment that made it so difficult for relative strength strategies? Simple answer: frequent leadership changes. In other words, there was a dearth of sustainable trends during this period of time.
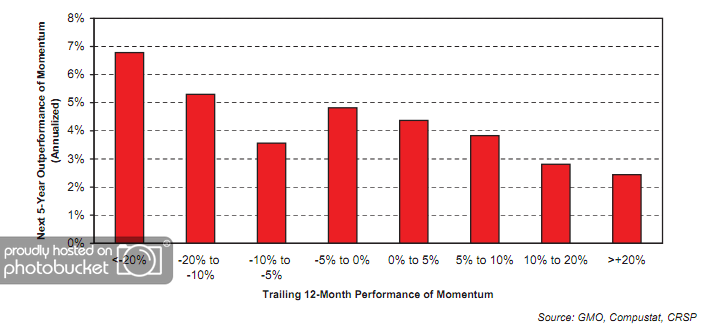
Now for the good news! After identifying four such periods of underperformance of relative strength strategies since 1927, GMO then calculated the outperformance of a simple relative strength model over the subsequent five years.
(Click to Enlarge)
GMO points out that relative strength strategies have generated nearly 7% annual outperformance over a cap-weighted benchmark over the 5 years following periods of being sharply out of favor. Right on cue, relative strength has mounted a comeback over the last year and a half as we detailed here.
I would hope that this data would get some investors excited! It certainly gives me reason to believe that the next several years could be very rewarding for relative strength investors.
Past performance is no guarantee of future returns.


not only is the ocnl out performance a concern but the drawdown. like you, i too have backtested many r/s strategies. the drawdown’s far exceed my trend following models.
do you think with the emergence of many inverse ETF’s to include w/ R/S, there will be less drawdown and better performance going forward? any suggests on how to implement a stoploss strategy? (i currently use 2times average drawdown). How about maintaining a permanent short term Put option equivalent to proft?
Nearly all of the fully invested relative strength strategies that I have seen have higher standard deviation than the market and can have market-like drawdowns periodically. However, that seems to be reasonable if you can generate significant outperformance over time.
We have also done a lot of work with applying relative strength to more conservative strategies that can shift into more defensive asset classes when needed. They may not get the same level of outperformance of a fully invested relative strength strategy, but they probably won’t have the same drawdowns either.
[...] our “Relative Strength Outlook Through 2014″ for an idea of what may come [...]
[...] our “Relative Strength Outlook Through 2014″ for an idea of what may come [...]