One of the simplest ways to determine the relative strength of small caps versus large caps is to use the SmartChart function to divide IWM (or another small cap ETF or index) by SPX. As shown below, large caps generally had the better relative strength in 2014 and 2015, as reflected by the declining RS chart, but it has been a different story in 2016. We have seen a series of higher highs and higher lows on the relative strength chart in 2016 as small cap indexes like the Russell 2000 have generally performed better than large caps.

Small cap momentum, however, had a slow start in the first half of the year, generally underperforming cap weighted small cap indexes like the Russell 2000. However, it looks like that may be changing. Our PowerShares DWA Small Cap Momentum ETF (DWAS) has pulled ahead of IWM so far in Q3 and both DWAS and IWM are well ahead of the S&P; 500 for the quarter as shown in the table below.

Source: Dorsey Wright. *7/1/16 – 9/8/16. Price return only, not inclusive of dividends or transaction costs.
A quick review of the index construction process for The PowerShares DWA Small Cap Momentum ETF (DWAS):
- Holds 200 stocks out of a universe of approximately 2,000 small cap stocks
- Stocks are selected for this index based on PnF relative strength characteristics
- The index is weighted by relative strength so that out of the 200 stocks that make it into the index, those with the better relative strength get the most weight
- Rebalanced quarterly to remove any stocks that have lost sufficient relative strength and to replace them with stronger stocks
Among the things that we can control in this index construction process is to make sure that the process remains the same from one quarter to the next. All 200 stocks meet the necessary relative strength requirements to go into the index when it is rebalanced. Each quarter we see that some of those holdings continue to perform well and some of them don’t. Shown below is the quarter to date performance for the 200 holdings in DWAS so far in Q3.
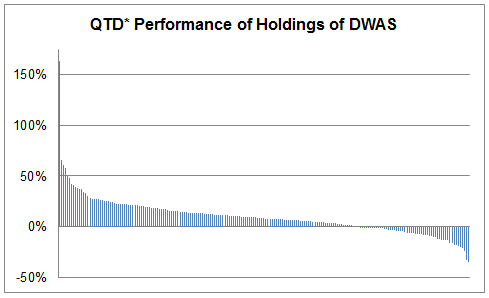
Source: Dorsey Wright. *7/1/16 – 9/8/16. Price return only, not inclusive of dividends or transaction costs.
The best performing holding is +162% and the worst performing holding is -34% so far this quarter. As is true each quarter, those stocks that maintain favorable relative strength will stay in the index and those that have sufficiently deteriorated will get replaced.
With U.S. equities ranked number 1 in DALI and with small caps showing improving relative strength, this may be an area that deserves some consideration.
Dorsey Wright is the index provider for a suite of momentum ETFs, including DWAS, at PowerShares. See www.powershares.com for more information. The relative strength strategy is NOT a guarantee. There may be times where all investments and strategies are unfavorable and depreciate in value.


