May 20, 2015
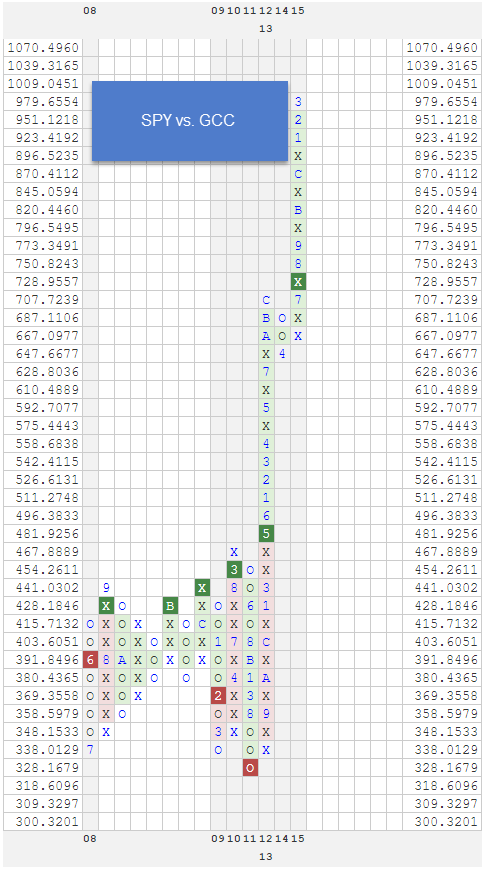
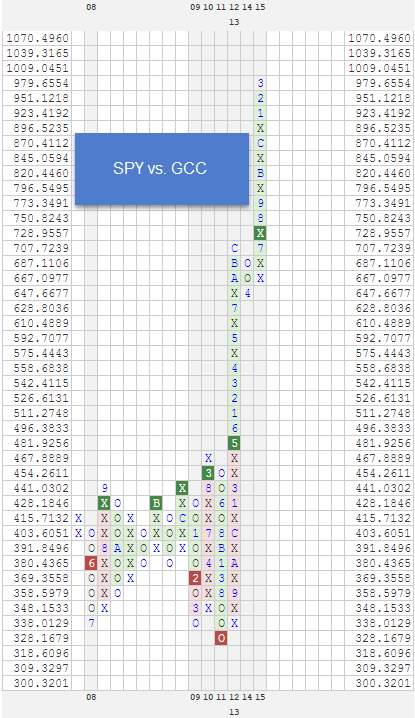
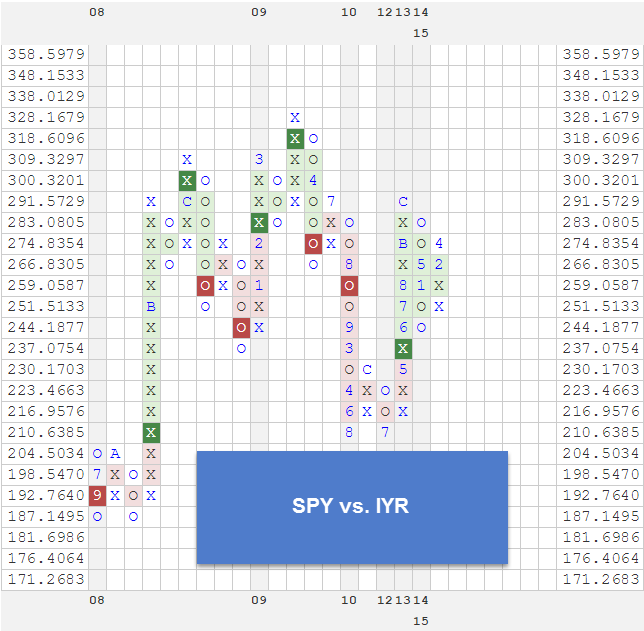
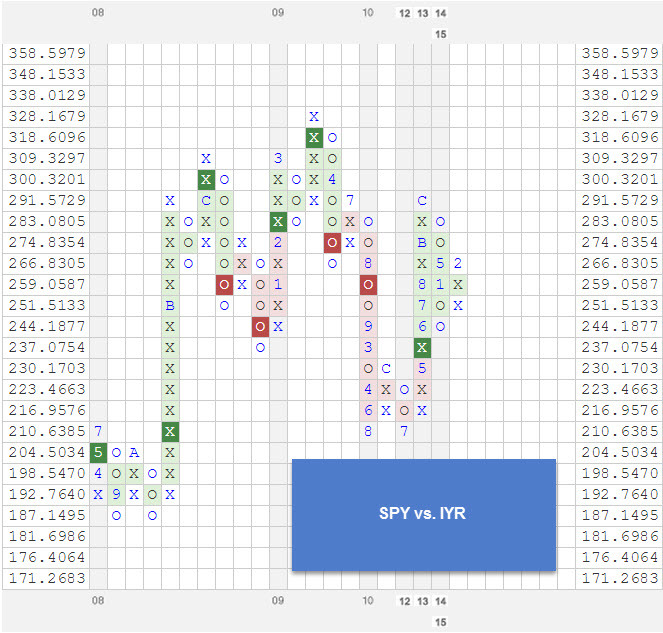
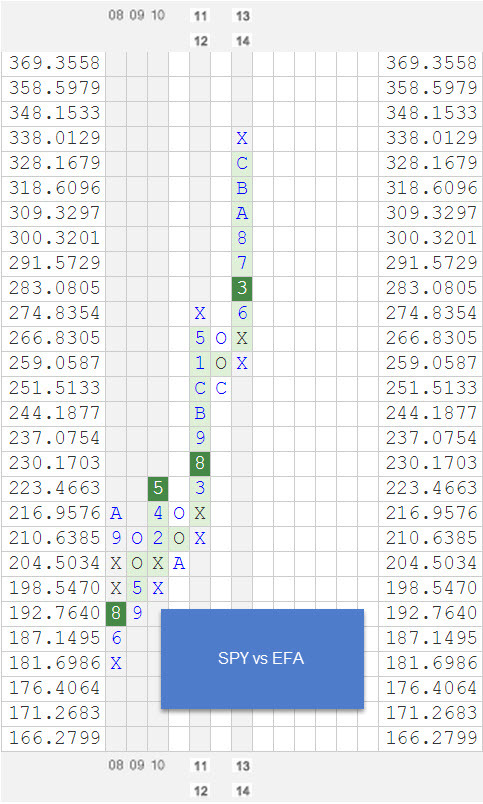
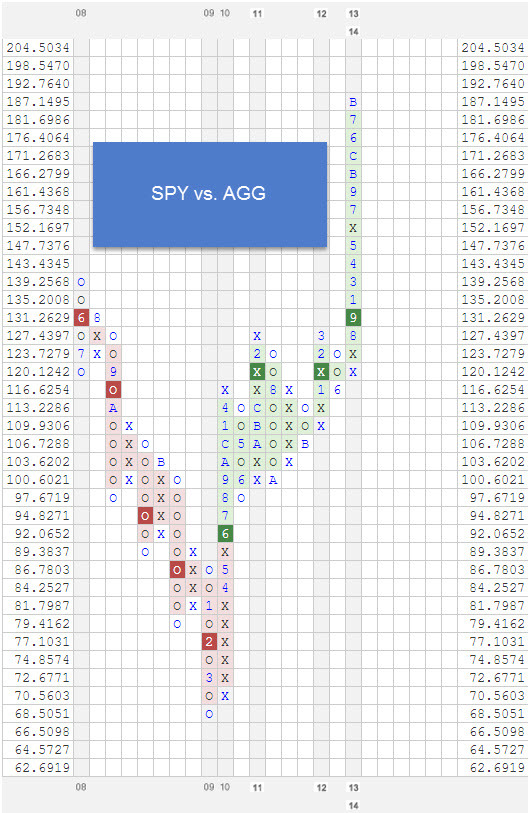
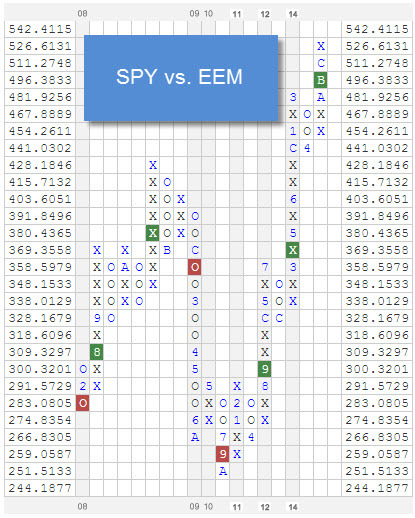
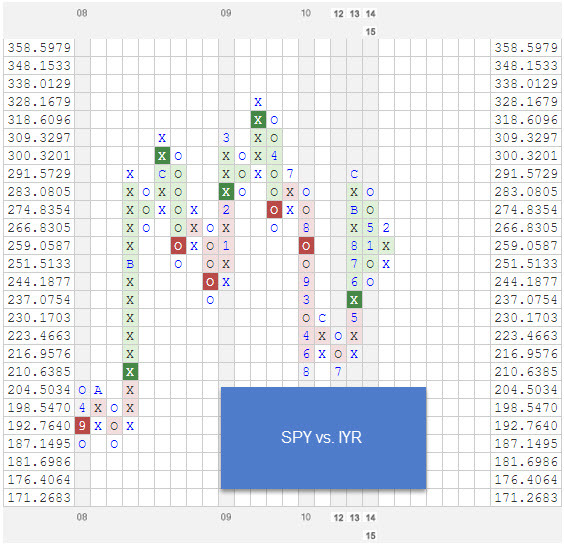
Point and Figure RS Charts are calculated by dividing one security by another and plotting the ratio on a PnF chart. When the ratio is rising, it is plotted in a column of X’s and reflects the numerator outperforming the denominator. Likewise, when the relative strength ratio is declining, it is plotted in a column of O’s and reflects the outperformance of the denominator.
Past performance is not indicative of future results. Potential for profits is accompanied by possibility of loss. This example is presented for illustrative purposes only and does not represent a past recommendation. The relative strength strategy is NOT a guarantee. There may be times where all investments and strategies are unfavorable and depreciate in value. Nothing contained herein should be construed as an offer to sell or the solicitation of an offer to buy any security. This post does not attempt to examine all the facts and circumstances which may be relevant to any product or security mentioned herein. We are not soliciting any action based on this document. It is for the general information of clients of Dorsey, Wright & Associates, LLC (“Dorsey, Wright & Associates”). This document does not constitute a personal recommendation or take into account the particular investment objectives, financial situations, or needs of individual clients. Before acting on any analysis, advice or recommendation in this document, clients should consider whether the security or strategy in question is suitable for their particular circumstances and, if necessary, seek professional advice.
 Leave a Comment » |
  Markets, Momentum |
  Permalink

Posted by:
Chris Moyer
May 19, 2015
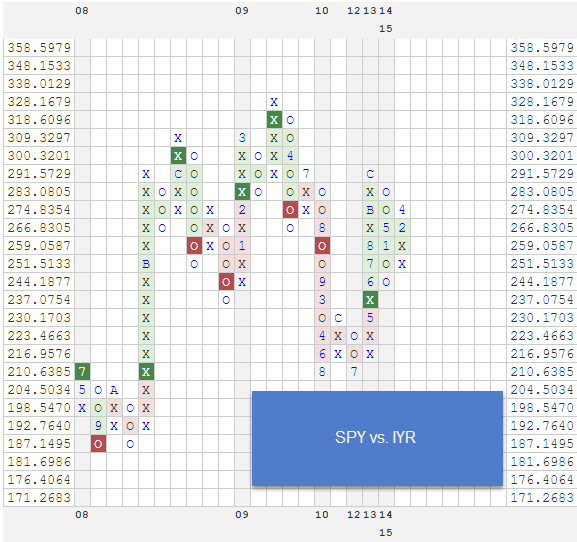
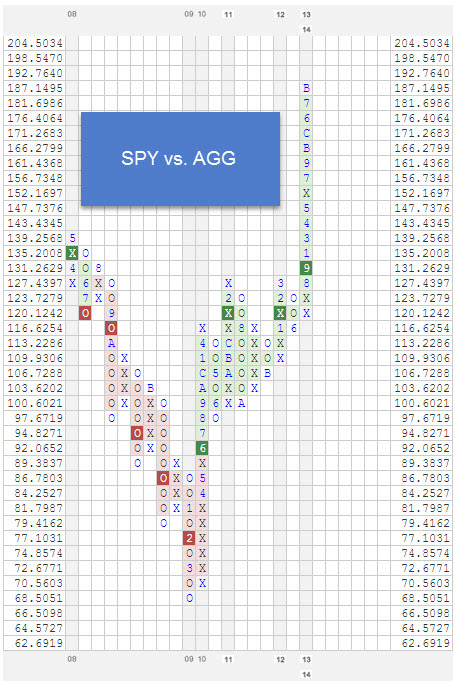
Point and Figure RS Charts are calculated by dividing one security by another and plotting the ratio on a PnF chart. When the ratio is rising, it is plotted in a column of X’s and reflects the numerator outperforming the denominator. Likewise, when the relative strength ratio is declining, it is plotted in a column of O’s and reflects the outperformance of the denominator.
Past performance is not indicative of future results. Potential for profits is accompanied by possibility of loss. This example is presented for illustrative purposes only and does not represent a past recommendation. The relative strength strategy is NOT a guarantee. There may be times where all investments and strategies are unfavorable and depreciate in value. Nothing contained herein should be construed as an offer to sell or the solicitation of an offer to buy any security. This post does not attempt to examine all the facts and circumstances which may be relevant to any product or security mentioned herein. We are not soliciting any action based on this document. It is for the general information of clients of Dorsey, Wright & Associates, LLC (“Dorsey, Wright & Associates”). This document does not constitute a personal recommendation or take into account the particular investment objectives, financial situations, or needs of individual clients. Before acting on any analysis, advice or recommendation in this document, clients should consider whether the security or strategy in question is suitable for their particular circumstances and, if necessary, seek professional advice.
Leave a Comment » | Markets, Momentum | Permalink
Posted by:
Chris Moyer
May 18, 2015

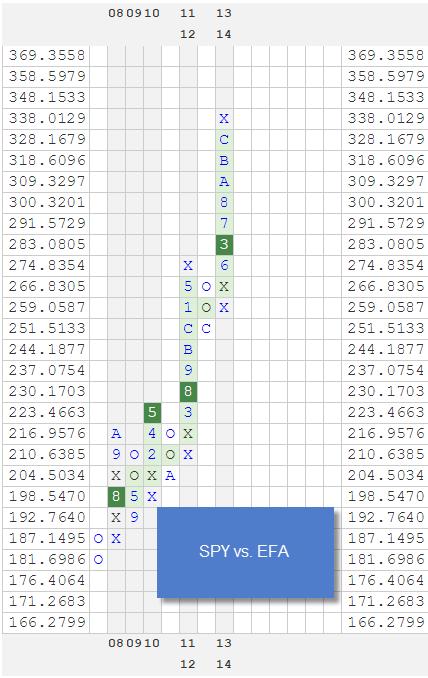
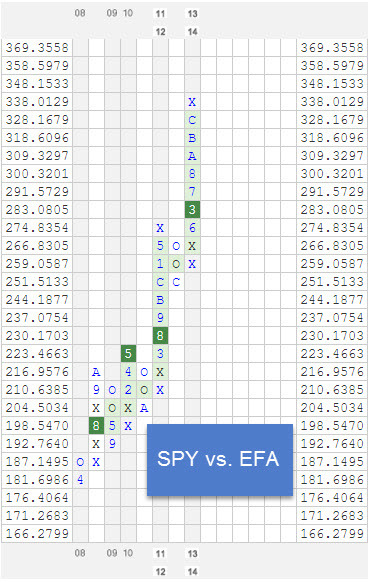
Point and Figure RS Charts are calculated by dividing one security by another and plotting the ratio on a PnF chart. When the ratio is rising, it is plotted in a column of X’s and reflects the numerator outperforming the denominator. Likewise, when the relative strength ratio is declining, it is plotted in a column of O’s and reflects the outperformance of the denominator.
Past performance is not indicative of future results. Potential for profits is accompanied by possibility of loss. This example is presented for illustrative purposes only and does not represent a past recommendation. The relative strength strategy is NOT a guarantee. There may be times where all investments and strategies are unfavorable and depreciate in value. Nothing contained herein should be construed as an offer to sell or the solicitation of an offer to buy any security. This post does not attempt to examine all the facts and circumstances which may be relevant to any product or security mentioned herein. We are not soliciting any action based on this document. It is for the general information of clients of Dorsey, Wright & Associates, LLC (“Dorsey, Wright & Associates”). This document does not constitute a personal recommendation or take into account the particular investment objectives, financial situations, or needs of individual clients. Before acting on any analysis, advice or recommendation in this document, clients should consider whether the security or strategy in question is suitable for their particular circumstances and, if necessary, seek professional advice.
Leave a Comment » | Markets, Momentum | Permalink
Posted by:
Chris Moyer
May 15, 2015
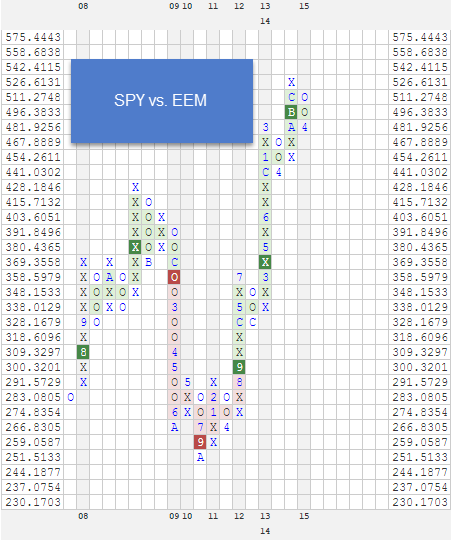
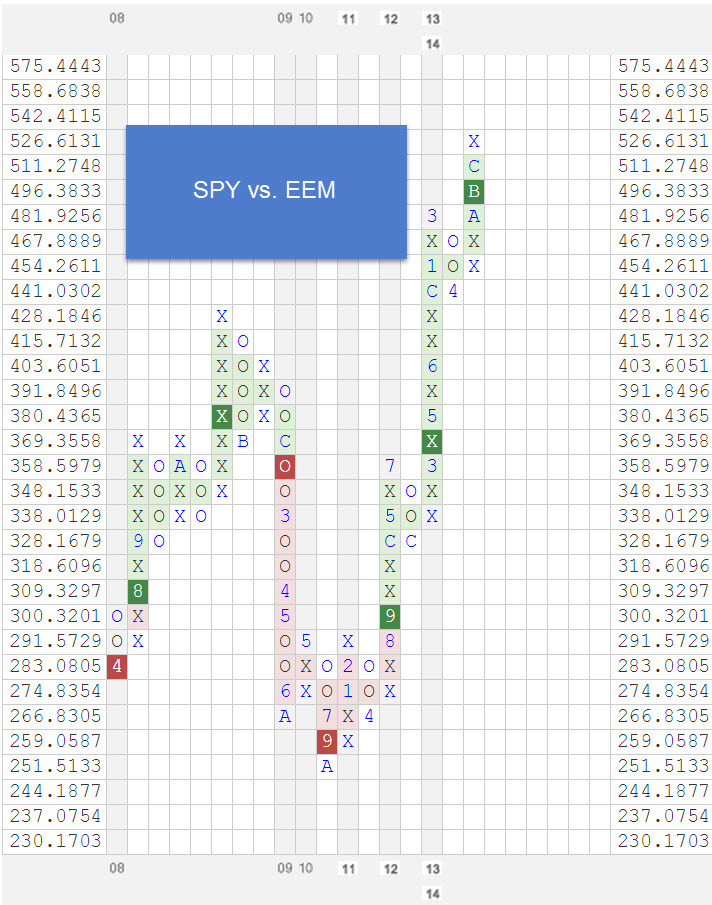
Point and Figure RS Charts are calculated by dividing one security by another and plotting the ratio on a PnF chart. When the ratio is rising, it is plotted in a column of X’s and reflects the numerator outperforming the denominator. Likewise, when the relative strength ratio is declining, it is plotted in a column of O’s and reflects the outperformance of the denominator.
Past performance is not indicative of future results. Potential for profits is accompanied by possibility of loss. This example is presented for illustrative purposes only and does not represent a past recommendation. The relative strength strategy is NOT a guarantee. There may be times where all investments and strategies are unfavorable and depreciate in value. Nothing contained herein should be construed as an offer to sell or the solicitation of an offer to buy any security. This post does not attempt to examine all the facts and circumstances which may be relevant to any product or security mentioned herein. We are not soliciting any action based on this document. It is for the general information of clients of Dorsey, Wright & Associates, LLC (“Dorsey, Wright & Associates”). This document does not constitute a personal recommendation or take into account the particular investment objectives, financial situations, or needs of individual clients. Before acting on any analysis, advice or recommendation in this document, clients should consider whether the security or strategy in question is suitable for their particular circumstances and, if necessary, seek professional advice.
Leave a Comment » | Markets, Momentum | Permalink
Posted by:
Chris Moyer
May 14, 2015
Point and Figure RS Charts are calculated by dividing one security by another and plotting the ratio on a PnF chart. When the ratio is rising, it is plotted in a column of X’s and reflects the numerator outperforming the denominator. Likewise, when the relative strength ratio is declining, it is plotted in a column of O’s and reflects the outperformance of the denominator.
Past performance is not indicative of future results. Potential for profits is accompanied by possibility of loss. This example is presented for illustrative purposes only and does not represent a past recommendation. The relative strength strategy is NOT a guarantee. There may be times where all investments and strategies are unfavorable and depreciate in value. Nothing contained herein should be construed as an offer to sell or the solicitation of an offer to buy any security. This post does not attempt to examine all the facts and circumstances which may be relevant to any product or security mentioned herein. We are not soliciting any action based on this document. It is for the general information of clients of Dorsey, Wright & Associates, LLC (“Dorsey, Wright & Associates”). This document does not constitute a personal recommendation or take into account the particular investment objectives, financial situations, or needs of individual clients. Before acting on any analysis, advice or recommendation in this document, clients should consider whether the security or strategy in question is suitable for their particular circumstances and, if necessary, seek professional advice.
Leave a Comment » | Markets, Momentum | Permalink
Posted by:
Chris Moyer
May 13, 2015
Point and Figure RS Charts are calculated by dividing one security by another and plotting the ratio on a PnF chart. When the ratio is rising, it is plotted in a column of X’s and reflects the numerator outperforming the denominator. Likewise, when the relative strength ratio is declining, it is plotted in a column of O’s and reflects the outperformance of the denominator.
Past performance is not indicative of future results. Potential for profits is accompanied by possibility of loss. This example is presented for illustrative purposes only and does not represent a past recommendation. The relative strength strategy is NOT a guarantee. There may be times where all investments and strategies are unfavorable and depreciate in value. Nothing contained herein should be construed as an offer to sell or the solicitation of an offer to buy any security. This post does not attempt to examine all the facts and circumstances which may be relevant to any product or security mentioned herein. We are not soliciting any action based on this document. It is for the general information of clients of Dorsey, Wright & Associates, LLC (“Dorsey, Wright & Associates”). This document does not constitute a personal recommendation or take into account the particular investment objectives, financial situations, or needs of individual clients. Before acting on any analysis, advice or recommendation in this document, clients should consider whether the security or strategy in question is suitable for their particular circumstances and, if necessary, seek professional advice.
Leave a Comment » | Markets, Momentum | Permalink
Posted by:
Chris Moyer
May 12, 2015
Point and Figure RS Charts are calculated by dividing one security by another and plotting the ratio on a PnF chart. When the ratio is rising, it is plotted in a column of X’s and reflects the numerator outperforming the denominator. Likewise, when the relative strength ratio is declining, it is plotted in a column of O’s and reflects the outperformance of the denominator.
http://Past performance is not indicative of future results. Potential for profits is accompanied by possibility of loss. This example is presented for illustrative purposes only and does not represent a past recommendation. The relative strength strategy is NOT a guarantee. There may be times where all investments and strategies are unfavorable and depreciate in value. Nothing contained herein should be construed as an offer to sell or the solicitation of an offer to buy any security. This post does not attempt to examine all the facts and circumstances which may be relevant to any product or security mentioned herein. We are not soliciting any action based on this document. It is for the general information of clients of Dorsey, Wright & Associates, LLC (“Dorsey, Wright & Associates”). This document does not constitute a personal recommendation or take into account the particular investment objectives, financial situations, or needs of individual clients. Before acting on any analysis, advice or recommendation in this document, clients should consider whether the security or strategy in question is suitable for their particular circumstances and, if necessary, seek professional advice.
Leave a Comment » | Markets, Momentum | Permalink
Posted by:
Chris Moyer
May 11, 2015
Point and Figure RS Charts are calculated by dividing one security by another and plotting the ratio on a PnF chart. When the ratio is rising, it is plotted in a column of X’s and reflects the numerator outperforming the denominator. Likewise, when the relative strength ratio is declining, it is plotted in a column of O’s and reflects the outperformance of the denominator.
Past performance is not indicative of future results. Potential for profits is accompanied by possibility of loss. This example is presented for illustrative purposes only and does not represent a past recommendation. The relative strength strategy is NOT a guarantee. There may be times where all investments and strategies are unfavorable and depreciate in value. Nothing contained herein should be construed as an offer to sell or the solicitation of an offer to buy any security. This post does not attempt to examine all the facts and circumstances which may be relevant to any product or security mentioned herein. We are not soliciting any action based on this document. It is for the general information of clients of Dorsey, Wright & Associates, LLC (“Dorsey, Wright & Associates”). This document does not constitute a personal recommendation or take into account the particular investment objectives, financial situations, or needs of individual clients. Before acting on any analysis, advice or recommendation in this document, clients should consider whether the security or strategy in question is suitable for their particular circumstances and, if necessary, seek professional advice.
Leave a Comment » | Markets, Momentum | Permalink
Posted by:
Chris Moyer
May 6, 2015
Point and Figure RS Charts are calculated by dividing one security by another and plotting the ratio on a PnF chart. When the ratio is rising, it is plotted in a column of X’s and reflects the numerator outperforming the denominator. Likewise, when the relative strength ratio is declining, it is plotted in a column of O’s and reflects the outperformance of the denominator.
Past performance is not indicative of future results. Potential for profits is accompanied by possibility of loss. This example is presented for illustrative purposes only and does not represent a past recommendation. The relative strength strategy is NOT a guarantee. There may be times where all investments and strategies are unfavorable and depreciate in value. Nothing contained herein should be construed as an offer to sell or the solicitation of an offer to buy any security. This post does not attempt to examine all the facts and circumstances which may be relevant to any product or security mentioned herein. We are not soliciting any action based on this document. It is for the general information of clients of Dorsey, Wright & Associates, LLC (“Dorsey, Wright & Associates”). This document does not constitute a personal recommendation or take into account the particular investment objectives, financial situations, or needs of individual clients. Before acting on any analysis, advice or recommendation in this document, clients should consider whether the security or strategy in question is suitable for their particular circumstances and, if necessary, seek professional advice.
Leave a Comment » | Markets, Momentum | Permalink
Posted by:
Chris Moyer
May 4, 2015

Point and Figure RS Charts are calculated by dividing one security by another and plotting the ratio on a PnF chart. When the ratio is rising, it is plotted in a column of X’s and reflects the numerator outperforming the denominator. Likewise, when the relative strength ratio is declining, it is plotted in a column of O’s and reflects the outperformance of the denominator.
Past performance is not indicative of future results. Potential for profits is accompanied by possibility of loss. This example is presented for illustrative purposes only and does not represent a past recommendation. The relative strength strategy is NOT a guarantee. There may be times where all investments and strategies are unfavorable and depreciate in value. Nothing contained herein should be construed as an offer to sell or the solicitation of an offer to buy any security. This post does not attempt to examine all the facts and circumstances which may be relevant to any product or security mentioned herein. We are not soliciting any action based on this document. It is for the general information of clients of Dorsey, Wright & Associates, LLC (“Dorsey, Wright & Associates”). This document does not constitute a personal recommendation or take into account the particular investment objectives, financial situations, or needs of individual clients. Before acting on any analysis, advice or recommendation in this document, clients should consider whether the security or strategy in question is suitable for their particular circumstances and, if necessary, seek professional advice.
Leave a Comment » | Markets, Momentum | Permalink
Posted by:
Chris Moyer
April 30, 2015

Point and Figure RS Charts are calculated by dividing one security by another and plotting the ratio on a PnF chart. When the ratio is rising, it is plotted in a column of X’s and reflects the numerator outperforming the denominator. Likewise, when the relative strength ratio is declining, it is plotted in a column of O’s and reflects the outperformance of the denominator.
Past performance is not indicative of future results. Potential for profits is accompanied by possibility of loss. This example is presented for illustrative purposes only and does not represent a past recommendation. The relative strength strategy is NOT a guarantee. There may be times where all investments and strategies are unfavorable and depreciate in value. Nothing contained herein should be construed as an offer to sell or the solicitation of an offer to buy any security. This post does not attempt to examine all the facts and circumstances which may be relevant to any product or security mentioned herein. We are not soliciting any action based on this document. It is for the general information of clients of Dorsey, Wright & Associates, LLC (“Dorsey, Wright & Associates”). This document does not constitute a personal recommendation or take into account the particular investment objectives, financial situations, or needs of individual clients. Before acting on any analysis, advice or recommendation in this document, clients should consider whether the security or strategy in question is suitable for their particular circumstances and, if necessary, seek professional advice.
Leave a Comment » | Markets, Momentum | Permalink
Posted by:
Chris Moyer
April 29, 2015

Point and Figure RS Charts are calculated by dividing one security by another and plotting the ratio on a PnF chart. When the ratio is rising, it is plotted in a column of X’s and reflects the numerator outperforming the denominator. Likewise, when the relative strength ratio is declining, it is plotted in a column of O’s and reflects the outperformance of the denominator.
Past performance is not indicative of future results. Potential for profits is accompanied by possibility of loss. This example is presented for illustrative purposes only and does not represent a past recommendation. The relative strength strategy is NOT a guarantee. There may be times where all investments and strategies are unfavorable and depreciate in value. Nothing contained herein should be construed as an offer to sell or the solicitation of an offer to buy any security. This post does not attempt to examine all the facts and circumstances which may be relevant to any product or security mentioned herein. We are not soliciting any action based on this document. It is for the general information of clients of Dorsey, Wright & Associates, LLC (“Dorsey, Wright & Associates”). This document does not constitute a personal recommendation or take into account the particular investment objectives, financial situations, or needs of individual clients. Before acting on any analysis, advice or recommendation in this document, clients should consider whether the security or strategy in question is suitable for their particular circumstances and, if necessary, seek professional advice.
Leave a Comment » | Markets, Momentum | Permalink
Posted by:
Chris Moyer
April 28, 2015
Point and Figure RS Charts are calculated by dividing one security by another and plotting the ratio on a PnF chart. When the ratio is rising, it is plotted in a column of X’s and reflects the numerator outperforming the denominator. Likewise, when the relative strength ratio is declining, it is plotted in a column of O’s and reflects the outperformance of the denominator.
Past performance is not indicative of future results. Potential for profits is accompanied by possibility of loss. This example is presented for illustrative purposes only and does not represent a past recommendation. The relative strength strategy is NOT a guarantee. There may be times where all investments and strategies are unfavorable and depreciate in value. Nothing contained herein should be construed as an offer to sell or the solicitation of an offer to buy any security. This post does not attempt to examine all the facts and circumstances which may be relevant to any product or security mentioned herein. We are not soliciting any action based on this document. It is for the general information of clients of Dorsey, Wright & Associates, LLC (“Dorsey, Wright & Associates”). This document does not constitute a personal recommendation or take into account the particular investment objectives, financial situations, or needs of individual clients. Before acting on any analysis, advice or recommendation in this document, clients should consider whether the security or strategy in question is suitable for their particular circumstances and, if necessary, seek professional advice.
Leave a Comment » | Markets, Momentum | Permalink
Posted by:
Chris Moyer
April 27, 2015

Point and Figure RS Charts are calculated by dividing one security by another and plotting the ratio on a PnF chart. When the ratio is rising, it is plotted in a column of X’s and reflects the numerator outperforming the denominator. Likewise, when the relative strength ratio is declining, it is plotted in a column of O’s and reflects the outperformance of the denominator.
Past performance is not indicative of future results. Potential for profits is accompanied by possibility of loss. This example is presented for illustrative purposes only and does not represent a past recommendation. The relative strength strategy is NOT a guarantee. There may be times where all investments and strategies are unfavorable and depreciate in value. Nothing contained herein should be construed as an offer to sell or the solicitation of an offer to buy any security. This post does not attempt to examine all the facts and circumstances which may be relevant to any product or security mentioned herein. We are not soliciting any action based on this document. It is for the general information of clients of Dorsey, Wright & Associates, LLC (“Dorsey, Wright & Associates”). This document does not constitute a personal recommendation or take into account the particular investment objectives, financial situations, or needs of individual clients. Before acting on any analysis, advice or recommendation in this document, clients should consider whether the security or strategy in question is suitable for their particular circumstances and, if necessary, seek professional advice.
Leave a Comment » | Markets, Momentum | Permalink
Posted by:
Chris Moyer
April 24, 2015
Past performance is not indicative of future results. Potential for profits is accompanied by possibility of loss. This example is presented for illustrative purposes only and does not represent a past recommendation. The relative strength strategy is NOT a guarantee. There may be times where all investments and strategies are unfavorable and depreciate in value. Nothing contained herein should be construed as an offer to sell or the solicitation of an offer to buy any security. This post does not attempt to examine all the facts and circumstances which may be relevant to any product or security mentioned herein. We are not soliciting any action based on this document. It is for the general information of clients of Dorsey, Wright & Associates, LLC (“Dorsey, Wright & Associates”). This document does not constitute a personal recommendation or take into account the particular investment objectives, financial situations, or needs of individual clients. Before acting on any analysis, advice or recommendation in this document, clients should consider whether the security or strategy in question is suitable for their particular circumstances and, if necessary, seek professional advice.
Leave a Comment » | Markets, Momentum | Permalink
Posted by:
Chris Moyer
April 22, 2015

Point and Figure RS Charts are calculated by dividing one security by another and plotting the ratio on a PnF chart. When the ratio is rising, it is plotted in a column of X’s and reflects the numerator outperforming the denominator. Likewise, when the relative strength ratio is declining, it is plotted in a column of O’s and reflects the outperformance of the denominator.
Past performance is not indicative of future results. Potential for profits is accompanied by possibility of loss. This example is presented for illustrative purposes only and does not represent a past recommendation. The relative strength strategy is NOT a guarantee. There may be times where all investments and strategies are unfavorable and depreciate in value. Nothing contained herein should be construed as an offer to sell or the solicitation of an offer to buy any security. This post does not attempt to examine all the facts and circumstances which may be relevant to any product or security mentioned herein. We are not soliciting any action based on this document. It is for the general information of clients of Dorsey, Wright & Associates, LLC (“Dorsey, Wright & Associates”). This document does not constitute a personal recommendation or take into account the particular investment objectives, financial situations, or needs of individual clients. Before acting on any analysis, advice or recommendation in this document, clients should consider whether the security or strategy in question is suitable for their particular circumstances and, if necessary, seek professional advice.
Leave a Comment » | Markets, Momentum | Permalink
Posted by:
Chris Moyer
April 21, 2015

Point and Figure RS Charts are calculated by dividing one security by another and plotting the ratio on a PnF chart. When the ratio is rising, it is plotted in a column of X’s and reflects the numerator outperforming the denominator. Likewise, when the relative strength ratio is declining, it is plotted in a column of O’s and reflects the outperformance of the denominator.
Past performance is not indicative of future results. Potential for profits is accompanied by possibility of loss. This example is presented for illustrative purposes only and does not represent a past recommendation. The relative strength strategy is NOT a guarantee. There may be times where all investments and strategies are unfavorable and depreciate in value. Nothing contained herein should be construed as an offer to sell or the solicitation of an offer to buy any security. This post does not attempt to examine all the facts and circumstances which may be relevant to any product or security mentioned herein. We are not soliciting any action based on this document. It is for the general information of clients of Dorsey, Wright & Associates, LLC (“Dorsey, Wright & Associates”). This document does not constitute a personal recommendation or take into account the particular investment objectives, financial situations, or needs of individual clients. Before acting on any analysis, advice or recommendation in this document, clients should consider whether the security or strategy in question is suitable for their particular circumstances and, if necessary, seek professional advice.
Leave a Comment » | Markets, Momentum | Permalink
Posted by:
Chris Moyer
April 20, 2015
Point and Figure RS Charts are calculated by dividing one security by another and plotting the ratio on a PnF chart. When the ratio is rising, it is plotted in a column of X’s and reflects the numerator outperforming the denominator. Likewise, when the relative strength ratio is declining, it is plotted in a column of O’s and reflects the outperformance of the denominator.
Past performance is not indicative of future results. Potential for profits is accompanied by possibility of loss. This example is presented for illustrative purposes only and does not represent a past recommendation. The relative strength strategy is NOT a guarantee. There may be times where all investments and strategies are unfavorable and depreciate in value. Nothing contained herein should be construed as an offer to sell or the solicitation of an offer to buy any security. This post does not attempt to examine all the facts and circumstances which may be relevant to any product or security mentioned herein. We are not soliciting any action based on this document. It is for the general information of clients of Dorsey, Wright & Associates, LLC (“Dorsey, Wright & Associates”). This document does not constitute a personal recommendation or take into account the particular investment objectives, financial situations, or needs of individual clients. Before acting on any analysis, advice or recommendation in this document, clients should consider whether the security or strategy in question is suitable for their particular circumstances and, if necessary, seek professional advice.
Leave a Comment » | Markets, Momentum | Permalink
Posted by:
Chris Moyer
April 17, 2015

Point and Figure RS Charts are calculated by dividing one security by another and plotting the ratio on a PnF chart. When the ratio is rising, it is plotted in a column of X’s and reflects the numerator outperforming the denominator. Likewise, when the relative strength ratio is declining, it is plotted in a column of O’s and reflects the outperformance of the denominator.
Past performance is not indicative of future results. Potential for profits is accompanied by possibility of loss. This example is presented for illustrative purposes only and does not represent a past recommendation. The relative strength strategy is NOT a guarantee. There may be times where all investments and strategies are unfavorable and depreciate in value. Nothing contained herein should be construed as an offer to sell or the solicitation of an offer to buy any security. This post does not attempt to examine all the facts and circumstances which may be relevant to any product or security mentioned herein. We are not soliciting any action based on this document. It is for the general information of clients of Dorsey, Wright & Associates, LLC (“Dorsey, Wright & Associates”). This document does not constitute a personal recommendation or take into account the particular investment objectives, financial situations, or needs of individual clients. Before acting on any analysis, advice or recommendation in this document, clients should consider whether the security or strategy in question is suitable for their particular circumstances and, if necessary, seek professional advice.
Leave a Comment » | Markets, Momentum | Permalink
Posted by:
Chris Moyer
April 16, 2015
Point and Figure RS Charts are calculated by dividing one security by another and plotting the ratio on a PnF chart. When the ratio is rising, it is plotted in a column of X’s and reflects the numerator outperforming the denominator. Likewise, when the relative strength ratio is declining, it is plotted in a column of O’s and reflects the outperformance of the denominator.
Past performance is not indicative of future results. Potential for profits is accompanied by possibility of loss. This example is presented for illustrative purposes only and does not represent a past recommendation. The relative strength strategy is NOT a guarantee. There may be times where all investments and strategies are unfavorable and depreciate in value. Nothing contained herein should be construed as an offer to sell or the solicitation of an offer to buy any security. This post does not attempt to examine all the facts and circumstances which may be relevant to any product or security mentioned herein. We are not soliciting any action based on this document. It is for the general information of clients of Dorsey, Wright & Associates, LLC (“Dorsey, Wright & Associates”). This document does not constitute a personal recommendation or take into account the particular investment objectives, financial situations, or needs of individual clients. Before acting on any analysis, advice or recommendation in this document, clients should consider whether the security or strategy in question is suitable for their particular circumstances and, if necessary, seek professional advice.
Leave a Comment » | Markets, Momentum | Permalink
Posted by:
Chris Moyer
April 15, 2015

Point and Figure RS Charts are calculated by dividing one security by another and plotting the ratio on a PnF chart. When the ratio is rising, it is plotted in a column of X’s and reflects the numerator outperforming the denominator. Likewise, when the relative strength ratio is declining, it is plotted in a column of O’s and reflects the outperformance of the denominator.
Past performance is not indicative of future results. Potential for profits is accompanied by possibility of loss. This example is presented for illustrative purposes only and does not represent a past recommendation. The relative strength strategy is NOT a guarantee. There may be times where all investments and strategies are unfavorable and depreciate in value. Nothing contained herein should be construed as an offer to sell or the solicitation of an offer to buy any security. This post does not attempt to examine all the facts and circumstances which may be relevant to any product or security mentioned herein. We are not soliciting any action based on this document. It is for the general information of clients of Dorsey, Wright & Associates, LLC (“Dorsey, Wright & Associates”). This document does not constitute a personal recommendation or take into account the particular investment objectives, financial situations, or needs of individual clients. Before acting on any analysis, advice or recommendation in this document, clients should consider whether the security or strategy in question is suitable for their particular circumstances and, if necessary, seek professional advice.
Leave a Comment » | Markets, Momentum | Permalink
Posted by:
Chris Moyer
April 14, 2015
Point and Figure RS Charts are calculated by dividing one security by another and plotting the ratio on a PnF chart. When the ratio is rising, it is plotted in a column of X’s and reflects the numerator outperforming the denominator. Likewise, when the relative strength ratio is declining, it is plotted in a column of O’s and reflects the outperformance of the denominator.
Past performance is not indicative of future results. Potential for profits is accompanied by possibility of loss. This example is presented for illustrative purposes only and does not represent a past recommendation. The relative strength strategy is NOT a guarantee. There may be times where all investments and strategies are unfavorable and depreciate in value. Nothing contained herein should be construed as an offer to sell or the solicitation of an offer to buy any security. This post does not attempt to examine all the facts and circumstances which may be relevant to any product or security mentioned herein. We are not soliciting any action based on this document. It is for the general information of clients of Dorsey, Wright & Associates, LLC (“Dorsey, Wright & Associates”). This document does not constitute a personal recommendation or take into account the particular investment objectives, financial situations, or needs of individual clients. Before acting on any analysis, advice or recommendation in this document, clients should consider whether the security or strategy in question is suitable for their particular circumstances and, if necessary, seek professional advice.
Leave a Comment » | Markets, Momentum | Permalink
Posted by:
Chris Moyer
April 13, 2015
Point and Figure RS Charts are calculated by dividing one security by another and plotting the ratio on a PnF chart. When the ratio is rising, it is plotted in a column of X’s and reflects the numerator outperforming the denominator. Likewise, when the relative strength ratio is declining, it is plotted in a column of O’s and reflects the outperformance of the denominator.
Past performance is not indicative of future results. Potential for profits is accompanied by possibility of loss. This example is presented for illustrative purposes only and does not represent a past recommendation. The relative strength strategy is NOT a guarantee. There may be times where all investments and strategies are unfavorable and depreciate in value. Nothing contained herein should be construed as an offer to sell or the solicitation of an offer to buy any security. This post does not attempt to examine all the facts and circumstances which may be relevant to any product or security mentioned herein. We are not soliciting any action based on this document. It is for the general information of clients of Dorsey, Wright & Associates, LLC (“Dorsey, Wright & Associates”). This document does not constitute a personal recommendation or take into account the particular investment objectives, financial situations, or needs of individual clients. Before acting on any analysis, advice or recommendation in this document, clients should consider whether the security or strategy in question is suitable for their particular circumstances and, if necessary, seek professional advice.
Leave a Comment » | Markets, Momentum | Permalink
Posted by:
Chris Moyer
April 10, 2015
Point and Figure RS Charts are calculated by dividing one security by another and plotting the ratio on a PnF chart. When the ratio is rising, it is plotted in a column of X’s and reflects the numerator outperforming the denominator. Likewise, when the relative strength ratio is declining, it is plotted in a column of O’s and reflects the outperformance of the denominator.
Past performance is not indicative of future results. Potential for profits is accompanied by possibility of loss. This example is presented for illustrative purposes only and does not represent a past recommendation. The relative strength strategy is NOT a guarantee. There may be times where all investments and strategies are unfavorable and depreciate in value. Nothing contained herein should be construed as an offer to sell or the solicitation of an offer to buy any security. This post does not attempt to examine all the facts and circumstances which may be relevant to any product or security mentioned herein. We are not soliciting any action based on this document. It is for the general information of clients of Dorsey, Wright & Associates, LLC (“Dorsey, Wright & Associates”). This document does not constitute a personal recommendation or take into account the particular investment objectives, financial situations, or needs of individual clients. Before acting on any analysis, advice or recommendation in this document, clients should consider whether the security or strategy in question is suitable for their particular circumstances and, if necessary, seek professional advice.
Leave a Comment » | Markets, Momentum | Permalink
Posted by:
Chris Moyer
April 9, 2015
Point and Figure RS Charts are calculated by dividing one security by another and plotting the ratio on a PnF chart. When the ratio is rising, it is plotted in a column of X’s and reflects the numerator outperforming the denominator. Likewise, when the relative strength ratio is declining, it is plotted in a column of O’s and reflects the outperformance of the denominator.
Past performance is not indicative of future results. Potential for profits is accompanied by possibility of loss. This example is presented for illustrative purposes only and does not represent a past recommendation. The relative strength strategy is NOT a guarantee. There may be times where all investments and strategies are unfavorable and depreciate in value. Nothing contained herein should be construed as an offer to sell or the solicitation of an offer to buy any security. This post does not attempt to examine all the facts and circumstances which may be relevant to any product or security mentioned herein. We are not soliciting any action based on this document. It is for the general information of clients of Dorsey, Wright & Associates, LLC (“Dorsey, Wright & Associates”). This document does not constitute a personal recommendation or take into account the particular investment objectives, financial situations, or needs of individual clients. Before acting on any analysis, advice or recommendation in this document, clients should consider whether the security or strategy in question is suitable for their particular circumstances and, if necessary, seek professional advice.
Leave a Comment » | Markets, Momentum | Permalink
Posted by:
Chris Moyer


