The chart below shows performance of US sectors and capitalizations over the trailing 12, 6, and 1 month(s). Performance updated through 6/28/2012.
The chart below shows performance of US sectors and capitalizations over the trailing 12, 6, and 1 month(s). Performance updated through 6/28/2012.
 Comments Off on Sector and Capitalization Performance |
  Markets |
  Permalink

Posted by: JP Lee
Ken Haman, a managing director at the Advisor Institute at AllianceBernstein responds to the following question posed by an advisor and published in Investment News:
Q: I’ve had some frustrating conversations with clients recently—trying to get them back in the market. Very few are taking my advice, even though they seem to know that staying on the sidelines is a mistake. What’s going on, and how can I get them “unstuck”?
A: Problems like this have to do with how people make decisions. Behavioral finance uses the term “inappropriate extrapolation”–and insights about it can help you understand your clients and respond to them more effectively.
To make any decision, human beings create a mental picture of the future. That’s what “expectations” are–the ability to take information from the past and present, and project it into the future. Unlike most animals, human beings can project far into the future; as a result, we are able to “plan ahead.” Unfortunately, we usually don’t create these future images terribly well. Instead of making a thoughtful assessment of what’s likely to happen in the future, we typically picture the future as just a continuation of the recent past.
Essentially, you want to learn how to install a positive picture of the future that the client feels is likely to happen in reality. Start by explaining the mechanisms of the market and illustrating visually how those mechanisms work. Many investors have only the vaguest understanding of the cause-effect dynamics in the markets. Instead of making thoughtful, well-informed decisions, they react to their perception of patterns and trends. Market “mechanisms” are those cause-effect relationships that equip financial professionals to invest rationally instead of speculating randomly.
By looking at how market mechanisms operated in both the recent and more distant past, you teach your clients how to think more strategically about the markets. This allows them to build a more vivid mental picture of market behaviors in the future. Make sure you explain market mechanisms visually as well as verbally: use charts and graphs that show market behaviors over time. Whenever possible, connect your investment recommendations to a clear explanation of the mechanism that is involved.
Second, provide an adequate level of detail about the mechanisms you explain. There’s a commonly held myth that clients aren’t interested in hearing about the markets. So, many financial advisors gloss over important information and rush to their proposal without creating a case the client understands. But clients are interested in understanding the mechanisms that drive their investment results–as long as your explanation is clearly illustrated and easy to understand.
Finally, you have to deliver your message with personal conviction–that you fully believe the future will look the way you anticipate. Your clients need to borrow your conviction and clarity about the future. That’s how they’ll build their sense of confidence in the decisions you’re asking them to make. Take a stand on what you believe about the future, and add the courage of your own convictions to the clarity of your explanation.
There is also an alternative approach of just being frank with the client and telling them that you don’t know exactly what the future holds, nor does anyone else. However, you adhere to a systematic relative strength process that gives you great flexibility to allocate to a wide range of asset classes depending on how the future unfolds. At times, the approach can be allocated very conservatively and at times it can be allocated quite aggressively. My experience has been that clients appreciate the honesty and are willing to embrace a trend-following approach that deals very effectively with not being able to see into the future.
—-this article originally appeared 1/12/2010. More than two years later, many clients are still on the sidelines. Many of them definitely do engage in inappropriate extrapolation! An advisor’s first duty is to be honest, but you’ve got to do it in a way that is motivating and not paralyzing.
1 Comment | From the Archives, Thought Process | Tagged: decision-making, investor behavior, systematic investment process, systematic relative strength, trend following | Permalink
Posted by: Mike Moody
The Investment Company Institute is the national association of U.S. investment companies, including mutual funds, closed-end funds, exchange-traded funds (ETFs), and unit investment trusts (UITs). Members of ICI manage total assets of $11.82 trillion and serve nearly 90 million shareholders. Flow estimates are derived from data collected covering more than 95 percent of industry assets and are adjusted to represent industry totals.
Comments Off on Fund Flows | Investor Behavior, Markets | Permalink
Posted by: JP Lee
Bill Bernstein is an asset allocation expert and the author of The Four Pillars of Investing. He happened to be at the current Morningstar Investment Conference and had an interview with Christine Benz, one of my favorite writers at Morningstar. She asked him about the purpose of fixed income in portfolios. I thought his answer was very revealing. It might not be controversial among financial advisors, but I doubt it is the thought process behind the retail public, which is currently pouring money into bond funds. (I’ve bolded the fun parts. You can read the whole transcript of the interview here.) I don’t agree with Mr. Bernstein’s view on a lot of things, but this seems pretty sensible to me.
Benz: Bill, I would like to focus on fixed income today. You are an expert on asset allocation, and I think that everywhere you go right now, you hear gloomy prognostications about the outlook for fixed income. I’m wondering if you can talk about how investors should approach that allocation right now given the prospective headwinds that could face fixed-income investors in the decades ahead?
Bernstein: Well, first of all, there’s a lot of concern about fixed income as you’ve already alluded to. People are worried that the returns are going to be low, and I think that’s almost a mathematical certainty. If yields stay where they are you’re going to get a very low yield; that’s the best-case scenario. If yields rise from here, then you are going to achieve probably negative returns with any duration at all. Yields on Treasuries have fallen over the past 30 years from the midteens down to 0%, 1%, or 2%; they can’t fall another 14% from here. And I think unfortunately people are expecting that to happen. So you have to back up and ask yourself, what is the purpose of your fixed-income assets? Well, they’re for emergency needs. They’re to buy stocks when they are cheap, so you can sleep at night. And they’re to buy that corner lot from your impecunious neighbor who suddenly has a need of cash. It’s not to achieve a return.
In short, bonds are part of your portfolio as a placeholder. You buy bonds when you don’t want the money to evaporate because you will need it later for an emergency, or because you will use it to buy other productive assets at a favorable price. Mr. Bernstein doesn’t think you should buy bonds here and expect a return. Sure, they might cushion a portfolio’s overall volatility, but his main point is that bonds right now should be held tactically in favor of deploying into other assets when the time is right.
I’d say this is pretty close to our view on fixed income. It’s a risk-off asset class, but it doesn’t make sense to have a large allocation when risk assets are performing well. Individuals might want bonds to reduce their portfolio volatility to levels they deem acceptable, but the focus should always be on assets that can grow.
19 Comments | Investor Behavior, Markets, Tactical Asset Alloc, Thought Process | Tagged: asset allocation, bonds, fixed income | Permalink
Posted by: Mike Moody
The chart below measures the percentage of high relative strength stocks that are trading above their 50-day moving average (universe of mid and large cap stocks.) As of 6/26/12.

The 10-day moving average of this indicator is 59% and the one-day reading is 52%.
Comments Off on High RS Diffusion Index | Relative Strength Research | Permalink
Posted by: JP Lee
Bloomberg has an article today entitled “ETFs Passive No More.” It’s an article about the rise of intelligent indexation. Here’s their thesis:
Exchange-traded funds are posing a new threat to the $7.8 trillion market for active mutual funds by challenging the notion ETFs are only good for tracking benchmarks.
Here’s their blurb about PDP:
The PowerShares DWA fund, which invests in U.S.-listed companies, uses an index that selects them based on “relative strength,” a proprietary screening methodology developed by Richmond, Virginia-based Dorsey, Wright & Associates Inc. The fund has advanced at an annual rate of 2 percent since its inception in March 2007, compared with the 1.2 percent gain for the Standard & Poor’s 500 Index over the same period, and the 3.8 percent increase in the Russell 3000 Growth Index.
Their offerings may further erode the market share of active mutual funds, sold by traditional money managers such as Fidelity Investments, Capital Group Cos. and Franklin Resources Inc. The companies tout the ability of their managers to beat benchmarks mostly through individual security selection.
“Historically, active managers held a unique appeal to prospective investors,” said Steven Bloom, who helped develop the first ETF in the 1980s and is now an assistant professor of economics at the U.S. Military Academy at West Point, New York.“Now, ETFs are infringing on that territory by holding out the prospect of alpha.”
The article points out that by using a rules-based investment process within an ETF, you can shoot for alpha, while getting the tax benefits of the ETF structure. Rules-based ETFs are going to continue to blur the line with active mutual funds over time. It’s also going to be interesting to see how many of the rules-based processes are robust and how many have been optimized. Curve-fitted performance will tend to degrade over time, while a truly adaptive model should be more consistent.
We think the trend toward intelligent indexes will continue and we’re excited to be one of the pioneers.
See www.powershares.com for more information about PDP. Past performance is no guarantee of future returns. A list of all holdings for the trailing 12 months is available upon request.
Comments Off on PDP in the News | From the MM, Media, Thought Process | Tagged: etf, PDP, relative strength, rules-based, systematic investment process, Technical Leaders | Permalink
Posted by: Mike Moody
Comments Off on Relative Strength Spread | Markets | Permalink
Posted by: Andy Hyer
That’s the title of a wonderful piece from Jonathan Hoenig writing for Smart Money. It’s an excellent reminder that the market is always the final arbiter.
Think of our job not as proclaiming how the markets will act, but observing how they are acting now, and attempting to position our own portfolios to hop along the trend.
So rather than command the markets to act as we think they should, investors should instead rely on the price action to observe how they’re performing and position him/herself accordingly. Because we’re not all-knowing: not you or I or Ben Bernanke, Bill Gross, Barton Biggs or anyone else. The market doesn’t know, care or consider anything we say or do.
That humility offers a more honest and realistic context by which to evaluate our next move.
In truth, the only way to make money is to follow the price trend. Relative strength is a good way to identify the strongest trends.
Comments Off on The Market Doesn’t Follow Orders | Markets, Thought Process | Tagged: price trend, relative strength, trend following | Permalink
Posted by: Mike Moody
Howard Ruff is quite the marketing genius. His 1979 book might have been terrible investment advice, but he clearly knows how to sell books.

Published in 1979
And right in the depths of despair of 2008, he rolled it out again (with a slightly changed title).

Published in 2008
Alhambra Investment Partners concluded their entertaining read The Apocalypse Bubble with the following:
I know it isn’t popular to be optimistic right now. A book about our bright economic future couldn’t even get published right now much less make the best seller list. But the best seller list is a lousy place to get investment advice. One of the most popular financial advice writers of the late 70s was Howard Ruff whose book How To Prosper During the Coming Bad Years was a best seller in 1979. He followed that up with Survive and Win in the Inflationary Eighties (1981). He recently updated his first best seller by adding In the 21st Century to the title. While you ponder the significance of that contrarian nugget, you might also consider the possibility that the Mayan calendar ends where it does because they ran out of government funding.
HT: Abnormal Returns
Comments Off on Howard Ruff: Marketing Genius | Investor Behavior, Media, Thought Process | Permalink
Posted by: Andy Hyer
The annals of investor behavior make for some pretty scary reading. Yet this story from the Wall Street Journal may take the cake. It is an article about the top-performing mutual fund of the decade and it shows with remarkable clarity how badly investors butcher their long-term returns. The article hits the premise right up front:
Meet the decade’s best-performing U.S. diversified stock mutual fund: Ken Heebner’s $3.7 billion CGM Focus Fund, which rose more than 18% annually and outpaced its closest rival by more than three percentage points.
Too bad investors weren’t around to enjoy much of those gains. The typical CGM Focus shareholder lost 11% annually in the 10 years ending Nov. 30, according to investment research firm Morningstar Inc.
It’s hard to know whether to laugh or cry. In a brutal decade, Mr. Heebner did a remarkable job, gaining 18% per year for his investors. The only investment acumen required to reap this 18% return was leaving the fund alone. Yet in the single best stock fund of the decade investors managed to misbehave and actually lose substantial amounts of money—11% annually.
Even Morningstar is not sure what to do with Mr. Heebner:
The fund, a highly concentrated portfolio typically holding fewer than 25 large-company stocks, offers “a really potent investment style, but it’s really hard for investors to use well,” says Christopher Davis, senior fund analyst at Morningstar.
I beg to differ. It’s really hard to use well?? What does that even mean? If it is, it’s only in the sense that a pet rock is really hard to care for.
Investor note: actively managed or adaptive products need to be left alone! The whole idea of an active or adaptive product is that the manager will handle things for you, instead of you having to do it yourself.
Unfortunately, there is an implicit belief among investors—and their advisors—that they can do a better job than the professionals running the funds, but every single study shows that belief to be false. There is not one study of which I am aware that shows retail investors (or retail investors assisted by advisors) outperforming professional investors. So where does that widespread belief come from?
From the biggest bogeyman in behavioral finance: overconfidence. Confidence is a wonderful trait in human beings. It gets us to attempt new things and to grow. From an evolutionary point of view, it is probably quite adaptive. In the financial arena, it’s a killer. Like high blood pressure, it’s a silent killer too, because no one ever believes they are overconfident.
At a Harvard conference on behavioral finance, I heard Nobel Prize winner Daniel Kahneman talk about the best way to combat overconfidence. He suggested intentionally taking what he called an “outside view.” Instead of placing yourself—with all of your incredible and unique talents and abilities—in the midst of the situation, he proposed using an outside individual, like your neighbor, for instance. Instead of asking, “What are the odds that I can quit my day job and open a top-performing hedge fund or play in the NBA?” ask instead, “What are the odds that my neighbor (the plumber, or the realtor, or the unemployed MBA) can quit his day job and open a top performing hedge fund or play in the NBA?” When you put things in an outside context like that, they always seem a lot less likely according to Kahneman. We all think of ourselves as special; in reality, we’re pretty much like everyone else.
Why, then, are investors so quick to bail out on everyone else? Overconfidence again. Our generally mistaken belief that we are special makes everyone else not quite as special as us. Overconfidence and belief in our own specialness makes us frame things completely differently: when we have a bad quarter, it was probably bad luck on a couple of stock picks; if Bill Miller (to choose a recent example) has a bad quarter, it’s probably because he’s lost his marbles and his investment process is irretriveably broken. We’d better bail out, fast. (A lot of people came to that conclusion over the past couple of years. In 2009, Legg Mason Value Trust was +40.6%, more than 14% ahead of its category peers.)
Think about an adaptive Dorsey, Wright Research model like DALI. As conditions change, it attempts to adapt by changing its holdings. Does it make sense to jump in and out of DALI depending on what happened last quarter or last year? Of course not. You either buy into the tactical approach or you don’t. Once you decide to buy into—presumably because you agree with the general premise—a managed mutual fund, a managed account, or an active index, for goodness sakes, leave it alone.
In financial markets, overconfidence is the enemy of patience. Overconfidence is expensive; patience with managed products can be quite rewarding. In the example of the CGM Focus Fund, Mr. Heebner grew $10,000 into $61,444 over the course of the last ten years. Investors in the fund, compounding at -11% annually, turned $10,000 into $3,118. The difference of $58,326 is the dollar value of patience in black and white.
—-this article originally appeared 1/6/2010. Unfortunately, human nature has not changed in the last two years! Investors still damage their returns with their impatience. Try not to be one of them!
2 Comments | From the Archives, From the MM, Investor Behavior, Thought Process | Tagged: behavioral finance, investor behavior, overconfidence, patience | Permalink
Posted by: Mike Moody
The table below shows the performance of a universe of mid and large cap U.S. equities, broken down by relative strength decile and quartile and then compared to the universe return. Those at the top of the ranks are those stocks which have the best intermediate-term relative strength. Relative strength strategies buy securities that have strong intermediate-term relative strength and hold them as long as they remain strong.
Last week’s performance (6/18/12 – 6/22/12) is as follows:
High relative strength stocks held up better than the universe last week.
Comments Off on Weekly RS Recap | Markets | Permalink
Posted by: Andy Hyer
Here we have the next round of the Dorsey, Wright Sentiment Survey, the first third-party sentiment poll. Participate to learn more about our Dorsey, Wright Polo Shirt raffle! Just follow the instructions after taking the poll, and we’ll enter you in the contest. Thanks to all our participants from last round.
As you know, when individuals self-report, they are always taller and more beautiful than when outside observers report their perceptions! Instead of asking individual investors to self-report whether they are bullish or bearish, we’d like financial advisors to weigh in and report on the actual behavior of clients. It’s two simple questions and will take no more than 20 seconds of your time. We’ll construct indicators from the data and report the results regularly on our blog–but we need your help to get a large statistical sample!
Click here to take Dorsey, Wright’s Client Sentiment Survey.
Contribute to the greater good! It’s painless, we promise.
Comments Off on Dorsey, Wright Client Sentiment Survey - 6/22/12 | Investor Behavior, Markets, Sentiment | Permalink
Posted by: JP Lee
Did you know that modern portfolio theory has been incorrectly applied by the industry for the past 60 years?
The foundation of investment education for CFP certificants is modern portfolio theory, which gives us tools to craft portfolios that effectively balance risk and return and reach the efficient frontier. Yet in his original paper, Markowitz himself acknowledged that the modern portfolio theory tool was simply designed to determine how to allocate a portfolio, given the expected returns, volatilities, and correlations of the available investments. Determining what those inputs should be, however, was left up to the person using the model. As a result, the risk of using modern portfolio theory – like any model – is that if poor inputs go into the model, poor results come out. Yet what happens when the inputs to modern portfolio theory are determined more proactively in response to an ever-changing investment environment? The asset allocation of the portfolio tactically shifts in response to varying inputs!
The evolution of the industry for much of the past 60 years since Markowitz’ seminal paper has been to assume that markets are at least “relatively” efficient and will follow their long-term trends, and as a result have used historical averages of return (mean), volatility (standard deviation), and correlation as inputs to determination an appropriate asset allocation. Yet the striking reality is that this methodology was never intended by the designer of the system itself; indeed, even in his original paper, Markowitz provided his own suggestions about how to apply his model, as follows:
To use [modern portfolio theory] in the selection of securities we must have procedures for finding reasonable [estimates of expected return and volatility]. These procedures, I believe, should combined statistical techniques and the judgment of practical men. My feeling is that the statistical computations should be used to arrive at a tentative set of [mean and volatility]. Judgment should then be used in increasing or decreasing some of these [mean and volatility inputs] on the basis of factors or nuances not taken into account by the formal computations…
…One suggestion as to tentative [mean and volatility] is to use the observed [mean and volatility] for some period of the past. I believe that better methods, which take into account more information, can be found.”
– Harry Markowitz, “Portfolio Selection”, The Journal of Finance, March 1952.
The whole article, The Rise of Tactical Asset Allocation, by Michael Kitces is a great summary of the problems with the way that modern portfolio has been applied. Of course, even if the industry had taken Markowitz’ advice and tried to forecast the inputs of standard deviation, covariance, and expected return they would have run into an entirely different problem—without a crystal ball, trying to forecast those inputs is no better than simply taking the historical means!
As Kitces correctly points out, there continues to be rising demand for an alternative approach to asset allocation. At Dorsey Wright, we espouse a trend following approach to asset allocation. Specifically, we allow relative strength to determine how a multi-asset class portfolio will be allocated. It is flexible, pragmatic, and it works. Try talking to your clients about it and don’t be surprised if they agree that it makes a lot of sense.
HT: Abnormal Returns
1 Comment | Relative Strength Research, Tactical Asset Alloc | Permalink
Posted by: Andy Hyer
Investors frequently rely on market indicators, such as moving averages, to decide when to buy, sell, or hold a stock. In fact we hear all the time of the magical powers of the moving average indicator, which has the mystical capabilities of keeping you out of trouble during market downturns, while making sure you are along for the ride on any rallies.
Therefore, we decided to test performance of Ken French’s High Relative Strength Index (an explanation of this index can be found here) against 50 and 200 day moving averages. We’ve calculated returns based on the assumption that the investor buys or holds when the price of the RS stock is above the moving average, and sells when the price drops below the moving average. So when the index is above its 50-, or 200-day moving average, we are fully invested, and when it’s below, we are out of the index.

Chart 1: Returns from 1963-2012. During this time period, basing buy and sell decisions off of the 50 day moving average is more successful than being fully invested. It is important to keep in mind that this data includes the bear markets of the 1970s and 2000s.

Chart 2: Returns from 1975-2007. When we start at a different point in time, the 50 day moving average performs much more poorly. In this dataset, we’ve cut out two large bear markets, and the effect on returns is drastic. In this case, it would have been better to just buy and hold.

Table 1: Annualized Returns by Time Periods. The average annualized returns also vary based on the period of time measured. At certain times, following moving averages outperforms being fully invested; but in other periods the opposite is true. Check out the difference between the two periods of ’83-’00 and ’66-’82. Using a moving average can either make or break your returns.


Charts 3 and 4: Fully Invested Ken French – Use of 50 Day MA (5 and 10 Year Performance). Investment performance based on moving averages varies greatly over time. In some periods, it performs incredibly, while in others it does terribly.
The performance of moving average based investment is directly related to the time period in which it is measured. As shown in Table 1, the returns can be completely different even in periods that partially overlap. The question then becomes not whether or not to use a moving average, but when! If you can predict the future, you’ll easily be able to decide whether or not to use a moving average when holding an index.
5 Comments | Relative Strength Research | Tagged: 200 day, 50 day, buy-and-hold, moving average, performance, relative strength, s&p500, stock market | Permalink
Posted by: Amanda Schaible
The chart below shows performance of US sectors and capitalizations over the trailing 12, 6, and 1 month(s). Performance updated through 6/21/2012.
Comments Off on Sector and Capitalization Performance | Markets | Permalink
Posted by: Andy Hyer
A new study by Aon Hewitt weighs in on how much savings you should have for retirement:
To have enough money for retirement, Aon Hewitt says, people will need savings on their retirement day that are 11 times their old annual pay.
With that level of savings, the researchers say, each year of retirement people can replace 85 percent of the pay a person was used to receiving annually when working. This assumes an average lifetime to age 87 for men and 88 for women.
Besides savings from 401(k) plans, the researchers assumed people would also receive Social Security. So Aon Hewitt figures the average retirement will require your savings and Social Security to provide 15.9 times your last year on the job. The calculations were based on methodology from the 1981 President’s Commission on Pension Policy and the Aon/Georgia State University Replacement Ratio study.
People preparing to replace 85 percent of their pre-retirement annual income per year would get 29 percent of their living expenses from Social Security and 56 percent from savings.
Having 11 times your old annual pay at the point of retirement doesn’t happen by accident. The image below says it all–commit early to be a consistent saver.
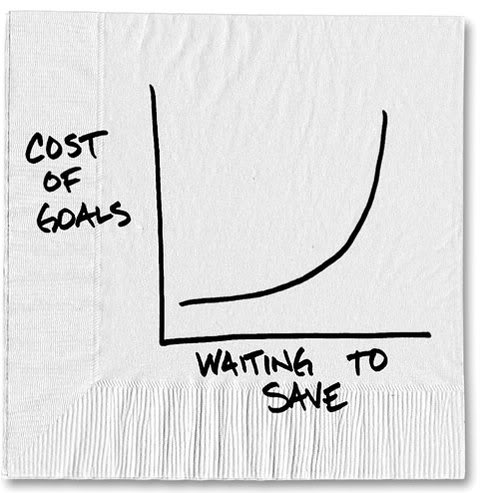
Source: Carl Richards
HT: iShares
Comments Off on New Study on Retirement Reality | Retirement/Saving | Tagged: retirement | Permalink
Posted by: Andy Hyer
The Investment Company Institute is the national association of U.S. investment companies, including mutual funds, closed-end funds, exchange-traded funds (ETFs), and unit investment trusts (UITs). Members of ICI manage total assets of $11.82 trillion and serve nearly 90 million shareholders. Flow estimates are derived from data collected covering more than 95 percent of industry assets and are adjusted to represent industry totals.
Comments Off on Fund Flows | Markets | Permalink
Posted by: Andy Hyer
The Journal of Indexes has the entire current issue devoted to articles on this topic, along with the best magazine cover ever. (Since it is, after all, the Journal of Indexes, you can probably guess how they came out on the active versus passive debate!)
One article by Craig Israelson, a finance professor at Brigham Young University, stood out. He discussed what he called “actively passive” portfolios, where a number of passive indexes are managed in an active way. (Both of the mutual funds that we sub-advise and our Global Macro separate account are essentially done this way, as we are using ETFs as the investment vehicles.) With a mix of seven asset classes, he looks at a variety of scenarios for being actively passive: perfectly good timing, perfectly poor timing, average timing, random timing, momentum, mean reversion, buying laggards, and annual rebalancing with various portfolio blends. I’ve clipped one of the tables from the paper below so that you can see the various outcomes:

Click to enlarge
Although there is only a slight mention of it in the article, the momentum portfolio (you would know it as relative strength) swamps everything but perfect market timing, with a terminal value more than 3X the next best strategy. Obviously, when it is well-executed, a relative strength strategy can add a lot of return. (The rebalancing also seemed to help a little bit over time and reduced the volatility.)
Maybe for Joe Retail Investor, who can’t control his emotions and/or his impulsive trading, asset allocation and rebalancing is the way to go, but if you have any kind of reasonable systematic process and you are after returns, the data show pretty clearly that relative strength should be the preferred strategy.
—-this article originally appeared 1/8/2010. Relative strength rocks.
1 Comment | From the Archives, From the MM, Markets, Relative Strength Research, Tactical Asset Alloc, Thought Process | Tagged: asset allocation, buy-and-hold, momentum, rebalancing, relative strength, systematic investment process, Tactical Asset Allocation | Permalink
Posted by: Mike Moody
The chart below measures the percentage of high relative strength stocks that are trading above their 50-day moving average (universe of mid and large cap stocks.) As of 6/19/12.
The 10-day moving average of this indicator is 49% and the one-day reading is 73%.
Comments Off on High RS Diffusion Index | Markets | Permalink
Posted by: Andy Hyer
Aswath Damodaran wrote the book on valuation, literally. He is a valuation guru, or as close to it as you are going to find. He readily admits that valuation is a biased process. From Business Insider:
Something that Aswath Damodaran reiterated frequently during his lecture is that valuation is not some sort of magical, objective science that will let you know what others don’t. It provides an anchor for your thinking and investment behavior.
Here are the three biggest myths of valuation from Professor Damodaran’s presentation:
- A valuation is an objective search for true value
- A good valuation provides a precise estimate of value
- The more quantitative a model, the better the valuation
Here’s the anecdote Professor Damodaran told to illustrate the first point:
“I have valued Microsoft every year since 1986, the year of their IPO. 26 years in a row. Every year through 2011 when I valued Microsoft I found it to be overvalued. You name the price, I found it overvalued. $2, $4, $8, “don’t buy, don’t buy, don’t buy.” Strange right? One of the great success stories of US equity markets over the last 50 years, and I wouldn’t have touched it one step of the way. Now I can give you access to every one of those models… You can dig through these models looking for clues as to why I found Microsoft to be overvalued, but you’d be looking in the wrong place. If you really want to know why I found Microsoft to be overvalued all of these years, all you need to do is walk up my office and look around. What you’re going to see is a bunch of computers with fruits on the back.”
Although there are multiple ways in which relative strength can be calculated, all investors using the same method are going to get the same result. There is no subjectivity in terms of assumptions and inputs. That kind of objectivity can really help eliminate emotions and biases from the investment process. To take Damodaran’s example, if Microsoft qualifies as one of the great success stories of the past 50 years, it would have had high relative strength somewhere along the line, by definition. End of story.
1 Comment | Investor Behavior, Markets, Thought Process | Tagged: relative strength, systematic investment process, value investing | Permalink
Posted by: Mike Moody
Investment News reports that assets in model ETF portfolios tracked by Morningstar Inc. grew to $46 billion by the end of the first quarter, up 43% from a year earlier.
The growing popularity of exchange-traded funds has led to a boom among money managers who specialize in using low-cost passive investments to build go-anywhere portfolios.
These model ETF portfolios typically use ETFs to invest globally across all asset classes, such as equities, fixed income and commodities, to shoot for a real return.
Financial advisers increasingly are outsourcing some of their client assets to these managers so that they can spend more time on clients and less time managing portfolios.
“As the ETF landscape has gotten more complicated, not all advisers feel comfortable building their own portfolios,” said Sue Thompson, head of iShares’ RIA Group. “Advisers have to either be the expert or find one.”
Managing go-anywhere portfolios is near and dear to our hearts here at Dorsey Wright. Click here to view a video presentation on our Global Macro portfolio, which has become our most widely used separate account strategy.

To receive the brochure for our Global Macro strategy, click here. For information about the Arrow DWA Tactical Fund (DWTFX), click here.
Click here and here for disclosures. Past performance is no guarantee of future returns.
2 Comments | Markets, Tactical Asset Alloc | Tagged: etf, exchange traded fund, investment, portfolio | Permalink
Posted by: Andy Hyer
The first two months of the year were pretty rough for global tactical asset allocation strategies as the best performance in those months came from asset classes with weak relative strength. However, things have since turned around as reflected by the percentile ranks of The Arrow DWA Tactical Fund (DWTFX), which we manage. This “go anywhere” fund can invest in domestic equities, international equities, currencies, commodities, real estate, and fixed income.
Source: Morningstar
Over the past three months, DWTFX has outperformed 81% of its peers as we have been able to capitalize on some more stable trends. Current holdings are shown below:
Before investing, please read the Fund’s prospectus and shareholder reports to learn about its investment strategy and potential risks. Mutual Fund investing involves risk including loss of principal. An investor should consider the Fund’s investment objective, charges, expenses, and risks carefully before investing. This and other information about the Fund is contained in the Fund’s prospectus, which can be obtained by calling 1-877-277-6933. Please read the prospectus carefully before investing. Distributed by Northern Lights Distributors, LLC, member FINRA/SIPC. See www.arrowfunds.com for more information.
Comments Off on DWTFX Turnaround | Markets, Tactical Asset Alloc | Permalink
Posted by: Andy Hyer
The chart below is the spread between the relative strength leaders and relative strength laggards (universe of mid and large cap stocks). When the chart is rising, relative strength leaders are performing better than relative strength laggards. As of 6/18/2012:
The RS Spread continues to trade above its 50 day moving average–a good sign for relative strength strategies.
Comments Off on Relative Strength Spread | Markets | Permalink
Posted by: Andy Hyer
Our latest sentiment survey was open from 6/8/12 to 6/15/12. The Dorsey, Wright Polo Shirt Raffle continues to drive advisor participation, and we greatly appreciate your support! We will announce the winner early next week. This round, we had 44 advisors participate in the survey. If you believe, as we do, that markets are driven by supply and demand, client behavior is important. We’re not asking what you think of the market—since most of our blog readers are financial advisors, we’re asking instead about the behavior of your clients. Then we’re aggregating responses exclusively for our readership. Your privacy will not be compromised in any way.
After the first 30 or so responses, the established pattern was simply magnified, so we are comfortable about the statistical validity of our sample. Most of the responses were from the U.S., but we also had multiple advisors respond from at least four other countries. Let’s get down to an analysis of the data! Note: You can click on any of the charts to enlarge them.
Question 1. Based on their behavior, are your clients currently more afraid of: a) getting caught in a stock market downdraft, or b) missing a stock market upturn?

Chart 1: Greatest Fear. From survey to survey, the S&P; 500 increased 0.59%, and the greatest fear numbers did not perform as expected. The fear of downturn group increased from 80% to 86%, while fear of a missed opportunity decreased from 20% to 14%. Client sentiment is still poor overall.

Chart 2: Greatest Fear Spread. Another way to look at this data is to examine the spread between the two groups. The spread decreased from 61% to 73%.
Question 2. Based on their behavior, how would you rate your clients’ current appetite for risk?

Chart 3: Average Risk Appetite. Once again, the average risk appetite performed as expected, rising from 2.48 to 2.62. As the market rose slightly, so did average risk appetite.

Chart 4: Risk Appetite Bell Curve. This chart uses a bell curve to break out the percentage of respondents at each risk appetite level. We are still seeing a low amount of risk, with most clients having a risk appetite of 2 or 3.

Chart 5: Risk appetite Bell Curve by Group. The next three charts use cross-sectional data. The chat plots the reported client risk appetite separately for the fear of downdraft and for the fear of missing upturn groups. This chart performs as expected, with the upturn group wanting more risk than the downturn group. However, even the fear of missing an upturn group doesn’t want a very high amount of risk.

Chart 6: Average Risk Appetite by Group. The average risk appetite of those who fear a downturn slightly decreased, even as the market rose. The average risk appetite of those who fear missing an upturn increased.

Chart 7: Risk Appetite Spread. This is a chart constructed from the data in Chart 6, where the average risk appetite of the downdraft group is subtracted from the average risk appetite of the missing upturn group. The spread increased this round, but is still within its normal range.
The S&P; 500 rose by 0.59% from survey to survey, and some of our indicators responded accordingly. Average risk appetite increased, but the amount of risk desired is still low. As the market does well, we would expect more people to fear missing an upturn; instead, more people feared a downturn. Overall, client sentiment remains poor.
No one can predict the future, as we all know, so instead of prognosticating, we will sit back and enjoy the ride. A rigorously tested, systematic investment process provides a great deal of comfort for clients during these types of fearful, highly uncertain market environments. Until next time, good trading and thank you for participating.
Comments Off on Dorsey, Wright Client Sentiment Survey Results – 6/8/12 | Investor Behavior, Markets, Sentiment | Tagged: client, investor behavior, sentiment, survey | Permalink
Posted by: Amanda Schaible
The table below shows the performance of a universe of mid and large cap U.S. equities, broken down by relative strength decile and quartile and then compared to the universe return. Those at the top of the ranks are those stocks which have the best intermediate-term relative strength. Relative strength strategies buy securities that have strong intermediate-term relative strength and hold them as long as they remain strong.
Last week’s performance (6/11/12 – 6/15/12) is as follows:
The top quartile of the relative strength ranks was essentially in line with the universe last week.
Comments Off on Weekly RS Recap | Markets | Permalink
Posted by: Andy Hyer
You are currently browsing the Systematic Relative Strength blog archives for June, 2012.


