A Reminder About Real Return

November 20, 2013

The main thing that should matter to a long-term investor is real return. Real return is return after inflation is factored in. When your real return is positive, you are actually increasing your purchasing power— and purchasing goods and services is the point of having a medium of exchange (money) in the first place.

A recent article in The New York Times serves as a useful reminder about real return.

The Dow Jones industrial average broke through 16,000 on Monday for the first time on record — well, at least in nominal terms. If you adjust for inflation, technically the highest level was on Jan. 14, 2000.

Adjusting for price changes, the Dow’s high today was still about 1.3 percent below its close on Jan. 14, 2000 (and about 1.6 percent below its intraday high from that date).

There’s a handy graphic as well, of the Dow Jones Industrial Average adjusted for inflation.

Source: New York Times/Bloomberg

(click on image to enlarge)

This chart, I think, is a good reminder that buy-and-hold (known in our office as “sit-and-take-it”) is not always a good idea. In most market environments there are asset classes that are providing real return, but that asset class is not always the broad stock market. There is value in tactical asset allocation, market segmentation, strategy diversification, and other ways to expose yourself to assets that are appreciating fast enough to augment your purchasing power.

I’ve read a number of pieces recently that contend that “risk-adjusted” returns are the most important investment outcome. Really? This would be awesome if I could buy a risk-adjusted basket of groceries at my local supermarket, but strangely, they seem to prefer the actual dollars. Your client could have wonderful risk-adjusted returns rolling Treasury bills, but would then also get to have a lovely risk-adjusted retirement in a mud hut. If those dollars are growing more slowly than inflation, you’re just moving in reverse.

Real returns are where it’s at.

Posted by:


Stock Market Sentiment Review

November 19, 2013

I’m still getting back into the swing of things after having the flu most of last week. In the midst of my stock market reading, I was struck by an article over the weekend from Abnormal Returns, a blog you should be reading, if you aren’t already. The editor had a selection of the blog posts that were most heavily trafficked from the prior week. Without further ado:

I count five of the top ten on the topic of market tops/bubbles/crashes!

Markets tend to top out when investors are feeling euphoric, not when they are tremendously concerned about the downside. In my opinion, investors are still quite nervous—and fairly far from euphoric right now.

Posted by:


Quote of the Week

November 19, 2013

Anyone who cannot cope with mathematics is not fully human. At best he is a tolerable subhuman who has learned to wear shoes, bathe, and not make messes in the house. —-Robert A. Heinlein from The Notebooks of Lazarus Long

I know, kind of harsh but funny at the same time. The thing is that you need to have a rudimentary understanding of mathematics–percentages and so on–or at least not be afraid of math in order to make sense of finance. It would be difficult to do any kind of reasonable asset allocation, portfolio management, or everyday financial decision-making without some degree of mathematical literacy.

Posted by:


The Top Ten Ways to Sabotage Your Portfolio

November 4, 2013

Good portfolio management is difficult, while poor portfolio management is almost effortless! In the spirit of David Letterman’s Top Ten list, here is my contribution to the genre of things to avoid, with a special nod to our brand of investing. I made a version of this presentation originally at a 1996 Dorsey Wright Broker Institute.

THE TOP TEN WAYS TO SABOTAGE YOUR PORTFOLIO

1. BE ARROGANT. Assume your competition is lazy and stupid. Don’t do your homework and don’t bother with a game plan. Panic if things don’t go well.

2. WHEN A SECTOR OR THE MARKET REVERSES UP, WAIT UNTIL YOU FEEL COMFORTABLE TO BUY. This is an ideal method for catching stocks 10 points higher.

3. BE AFRAID TO BUY STRONG STOCKS. This way you can avoid the big long-term relative strength winners.

4. SELL A STOCK ONLY BECAUSE IT HAS GONE UP. This is an excellent way to cut your profits short. (If you can’t stand prosperity, trim if you must, but don’t sell it all.)

5. BUY STOCKS IN SECTORS THAT ARE SUPER EXTENDED BECAUSE IT’S DIFFERENT THIS TIME. Not.

6. TRY TO BOTTOMFISH A STOCK IN A DOWNTREND. Instead, jump off a building and try to stop 5 floors before you hit the ground. Ouch.

7. BUY A STOCK ONLY BECAUSE IT’S A GOOD VALUE. There are two problems with this. 1) It can stay a good value by not moving for the next decade, or worse 2) it can become an even better value by dropping another 10 points.

8. HOLD ON TO LOSING STOCKS AND HOPE THEY COME BACK. An outstanding way to let your losses run. Combined with cutting your profits short, over time you can construct a diversified portfolio of losers and register it with the Kennel Club.

9. PURSUE PERFECTION. There are two diseases. 1) Hunting for the perfect method. Trying a new “system” each week will not get you to your goal. It requires remaining focused on one method, maintaining consistency and discipline, and making incremental improvements. 2) Waiting for the perfect trade. The sector is right, the market is supporting higher prices, the chart is good—try to buy it a point cheaper and miss it entirely. Doh. Better to be approximately right than precisely wrong.

10. MAKE INVESTMENT DECISIONS BASED ON A MAGAZINE COVER, MEDIA ARTICLES, OR PUNDITS. Take investment advice from a journalist or a hedge fund manager talking his book! Get fully engaged with your emotions of fear and greed! This is the method of choice for those interested in the fastest route to the poorhouse.

Posted by:


Quote of the Week

November 4, 2013

It is remarkable how much long-term advantage people like us have gotten by trying to be consistently not stupid, instead of trying to be very intelligent.—-Charlie Munger

Warren Buffett and Charlie Munger think that some of their advantage is just in trying not to do anything stupid. Indeed, it is doing stupid stuff that is usually the problem in investing. Of course, it doesn’t seem stupid at the time—indeed, it usually seems very compelling—which is why it is difficult to recognize and stop. I follow with my contribution to the genre.

HT: Morgan Housel and Abnormal Returns

Posted by:


Quote of the Week

October 20, 2013

The race is not always to the swift, nor the battle to the strong, but that’s the way to bet.—-Damon Runyon

There is a great deal of value in a systematic investment process—specifically, the systematic part!

Posted by:


More on Systematic Process

October 18, 2013

We use a systematic process for investment because we think that’s the best way to go. Our systematic process also happens to be adaptive because we think adaptation to the current market environment is also an important consideration. (If you don’t adapt you die.) Our decision to use a systematic process is grounded in evidence that, over time, systematic processes tend to win out over inconsistent human decision making. (See here, for example.)

The latest instance of this was an interesting article on Quartz about the coming wave of full-service coffee machines that may have the potential to replace baristas. Consider, for example, what this particular quotation says about the power of a systematic process:

In 2012, Julian Baggini, a British philosophy writer and coffee aficionado, wondered why dozens of Europe’s Michelin-starred restaurants were serving guests coffee that came out of vacuum-sealed plastic capsules manufactured by Nespresso. So he conducted a taste test on a small group of experts. A barista using the best, freshly-roasted beans went head to head with a Nespresso capsule coffee brewing machine. It’s the tale of John Henry all over again, only now it was a question of skill and grace rather than brute strength.

As the chefs at countless restaurants could have predicted, the Nespresso beat the barista.

Suffice it to say that most manufacturing nowadays is done by machine because it is usually faster, less expensive, and more accurate than a human. Perhaps you will miss terribly your nose-ringed, pink-haired, tatooed barista, but then again, maybe not so much.

Systematic investing has its problems—sometimes the adaptation seems too slow or too fast. Sometimes your process is just out of favor. But like a manufacturing process, a systematic investment process holds the promise of consistency and potential improvement as technology and new techniques are incorporated over time. While it may seem less romantic than the lone stock picker, systematic investment could well be the wave of the future.

HT to Abnormal Returns

Posted by:


Quote of the Week

October 13, 2013

Markets are fundamentally volatile. No way around it. Your problem is not in the math. There is no math to get you out of having to experience uncertainty.—-Ed Seykota

As long as humans are involved this is probably not going to change! It makes sense to use an adaptive investment strategy.

Posted by:


Rats, Humans, and Probability

October 9, 2013

Investors—or people generally—find it difficult to think in terms of probability. A quote from a recent ThinkAdvisor article on probability is instructive:

In multiple studies (most prominently those by Edwards and Estes, as reported by Philip Tetlock in his book Expert Political Judgment), subjects were asked to predict which side of a “T-maze” held food for a rat. The maze was rigged such that the food was randomly placed (no pattern), but 60% of the time on one side and 40% on the other. The rat quickly “gets it” and waits at the “60% side” every time and is thus correct 60% of the time. Human observers keep looking for patterns and choose sides in rough proportion to recent results. As a consequence, the humans were right only 52% of the time—they (we!) are much dumber than rats. We routinely misinterpret probabilistic strategies that accept the inevitability of randomness and error.

Even rats get probability better than people! It is for this reason that a systematic investing process can be so valuable. Away from the pressure and hubbub of the markets, strategies can be researched and probabilities investigated and calculated. Decisions can be made on the basis of probability because a systematic process incorporates the notion that there is a certain amount of randomness that cannot be overcome with clever decision-making.

Ironically, because humans have sophisticated pattern recognition skills built in, we see patterns in probability where there are none. A systematic investment process can reduce or eliminate the “overinterpretation” inherent in our own cleverness. When we can base our decisions only on the actual probabilities embedded in the data, those decisions will be much better over a large number of trials.

Good investing is never easy, but a systematic investing process can eliminate at least one barrier to good performance.

Posted by:


Dumb Talk About Smart Beta?

October 7, 2013

John Rekenthaler at Morningstar, who usually has some pretty smart stuff to say, took on the topic of smart beta in a recent article. Specifically, he examined a variety of smart beta factors with an eye to determining which ones were real and might persist. He also thought some factors might be fool’s gold.

Here’s what he had to say about value:

The value premium has long been known and continues to persist.

And here’s what he had to say about relative strength (momentum):

I have trouble seeing how momentum can succeed now that its existence is well documented.

The italics are mine. I didn’t take logic in college, but it seems disingenuous to argue that one factor will continue to work after it is well-known, while becoming well-known will cause the other factor to fail! (If you are biased in favor of value, just say so, but don’t use the same argument to reach two opposite conclusions.)

There are a variety of explanations about why momentum works, but just because academics can’t agree on which one is correct doesn’t mean it won’t continue to work. It is certainly possible that any anomaly could be arbitraged away, but Robert Levy’s relative strength work has been known since the 1960s and our 2005 paper in Technical Analysis of Stocks & Commodities showed it continued to work just fine just the way he published it. Academics under the spell of efficient markets trashed his work at the time too, but 40 years of subsequent returns shows the professors got it wrong.

However, I do have a background in psychology and I can hazard a guess as to why both the value and momentum factors will continue to persistthey are both uncomfortable to implement. It is very uncomfortable to buy deep value. There is a terrific fear that you are buying a value trap and that the impairment that created the value will continue or get worse. It also goes against human nature to buy momentum stocks after they have already outperformed significantly. There is a great fear that the stock will top and collapse right after you add it to your portfolio. Investors and clients are quite resistant to buying stocks after they have already doubled, for example, because there is a possibility of looking really dumb.

Here’s the reason I think both factors are psychological in origin: it is absurdly easy to screen for either value or momentum. Any idiot can implement either strategy with any free screener on the web. Pick your value metric or your momentum lookback period and away you go. In fact, this is pretty much exactly what James O’Shaughnessy did in What Works on Wall Street. Both factors worked well—and continue to work despite plenty of publicity. So the barrier is not that there is some secret formula, it’s just that investors are unwilling to implement either strategy in a systematic way–because of the psychological discomfort.

If I were to make an argument—the behavioral finance version—about which smart beta factor could potentially be arbitraged away over time, I would have to guess low volatility. If you ask clients whether they would prefer to buy stocks that a) had already dropped 50%, b) had already gone up 50%, or c) had low volatility, I think most of them would go with “c!” (Although I think it’s also possible that aversion to leverage will keep this factor going.)

Value and momentum also happen to work very well together. Value is a mean reversion factor, while momentum is a trend continuation factor. As AQR has shown, the excess returns of these two factors (unsurprisingly, once you understand how they are philosophical opposites) are uncorrelated. Combining them may have the potential to smooth out an equity return stream a little bit. Regardless, two good return factors are better than one!

Posted by:


Long-Only Momentum

October 4, 2013

Gary Antonacci has a very nice article at Optimal Momentum regarding long-only momentum. Most academic studies look at long-short momentum, while most practitioners (like us) use long-only momentum (also known as relative strength). Partly this is because it is somewhat impractical to short across hundreds of managed accounts, and partly because clients don’t usually want to have short positions. The article has another good reason, quoting from an Israel & Moskowitz paper:

Using data over the last 86 years in the U.S. stock market (from 1926 to 2011) and over the last four decades in international stockmarkets and other asset classes (from 1972 to 2011), we find that the importance of shorting is inconsequential for all strategies when looking at raw returns. For an investor who cares only about raw returns, the return premia to size, value, and momentum are dominated by the contribution from long positions.

In other words, most of your return comes from the long positions anyway.

The Israel & Moskowitz paper looks at raw long-only returns from capitalization, value, and momentum. Perhaps even more importantly, at least for the Modern Portfolio Theory crowd, it looks at CAPM alphas from these same segments on a long-only basis. The CAPM alpha, in theory, is the amount of excess return available after adjusting for each factor. Here’s the chart:

Source: Optimal Momentum

(click on image to enlarge)

From the Antonacci article, here’s what you are looking at and the results:

I&M; charts and tables show the top 30% of long-only momentum US stocks from 1927 through 2011 based on the past 12-month return skipping the most recent month. They also show the top 30% of value stocks using the standard book-to-market equity ratio, BE/ME, and the smallest 30% of US stocks based on market capitalization.

Long-only momentum produces an annual information ratio almost three times larger than value or size. Long-only versions of size, value, and momentum produce positive alphas, but those of size and value are statistically weak and only exist in the second half of the data. Momentum delivers significant abnormal performance relative to the market and does so consistently across all the data.

Looking at market alphas across decile spreads in the table above, there are no significant abnormal returns for size or value decile spreads over the entire 1926 to 2011 time period. Alphas for momentum decile portfolio spread returns, on the other hand, are statistically and economically large.

Mind-boggling right? On a long-only basis, momentum smokes both value and capitalization!

Israel & Moskowitz’s article is also quoted in the post, and here is what they say about their results:

Looking at these finer time slices, there is no significant size premium in any sub period after adjusting for the market. The value premium is positive in every sub period but is only statistically significant at the 5% level in one of the four 20-year periods, from 1970 to 1989. The momentum premium, however, is positive and statistically significant in every sub period, producing reliable alphas that range from 8.9 to 10.3% per year over the four sub periods.

Looking across different sized firms, we find that the momentum premium is present and stable across all size groups—there is little evidence that momentum is substantially stronger among small cap stocks over the entire 86-year U.S. sample period. The value premium, on the other hand, is largely concentrated only among small stocks and is insignificant among the largest two quintiles of stocks (largest 40% of NYSE stocks). Our smallest size groupings of stocks contain mostly micro-cap stocks that may be difficult to trade and implement in a real-world portfolio. The smallest two groupings of stocks contain firms that are much smaller than firms in the Russell 2000 universe.

What is this saying? Well, the value premium doesn’t appear to exist in the biggest NYSE stocks (the stuff your firm’s research covers). You can find value in micro-caps, but the effect is still not very significant relative to momentum in long-only portfolios. And momentum works across all cap levels, not just in the small cap area.

All of this is quite important if you are running long-only portfolios for clients, which is what most of the industry does. Relative strength (momentum) is a practical tool because it appears to generate excess return over many time periods and across all capitalizations.

Posted by:


Income-Producing Securities

October 3, 2013

According to Morningstar, the whole idea of income-producing securities is flawed—and I think they are right. In an article entitled “Option Selling Is Not Income,” author Philip Guziec points out that option income is not mysterious free money. Option selling can modify the risk-reward tradeoff for a portfolio, but the income is part of the total return, not some extra money that happens to be lying around.

By way of explanation, he shows a chart of an option income portfolio without the reinvestment of the income. As you can see below, it’s pretty grim.

Source: Morningstar

(click on image to enlarge)

Why is that? Well, the plummeting line is the one where you spend the income instead of reinvesting it in the portfolio. So much for an income-producing security that has “free” income. In this graphic context, it is very clear that the income is just one part of the total return. (You can read the whole article—the link is above—if you want more information on the specifics of an option income portfolio.)

However, I thought the article was great for another reason. Mr. Guziec generalizes the case of option income funds to all income securities. He writes:

In fact, the very concept of an income-producing security is a fallacy. A dollar of return is a dollar of return, whether that return comes from capital gains, coupons, dividends, or option premium.

I put the whole thing in bold because 1) I think it is important, and 2) most investors do not understand this apparently simple point. This can be generalized to investors who refuse to buy certain stocks because they don’t “have enough yield” or who prefer high-yield bonds to investment-grade bonds simply because they “have more yield.” In both cases, income is just part of the total return—and may also move you to a different part of the risk-return spectrum. There is nothing magic about income-producing securities, whether they are MLPs, dividend stocks, bonds, or anything else. What matters is the total return.

From a mathematical standpoint, shaving 25 basis points off of your portfolio every month to spend is no different than spending a 3% dividend yield. Once you can wrap your head around this concept, it’s easy to pursue the best opportunities in the market because you aren’t wearing blinders or forcing investments through a certain screen or set of filters. If your portfolio grows, that 25 basis points keeps getting to be a bigger number and that’s really what matters.

Posted by:


Quote of the Week

September 28, 2013

CAPE, the popular cyclically adjusted P/E ratio, for the S&P; 500 has signaled an “overvalued” market in all but nine months in the last 22 years. Financial metrics can make lots of sense in theory but be flawed in practice.—-Morgan Housel, Motley Fool

You can always find some reason not to invest, or you can just let the trend be your friend.

Posted by:


Underperformance

September 26, 2013

Whether you are an investment manager or a client, underperformance is a fact of life, no matter what strategy or methodology you subscribe to. If you don’t believe me, take a look at this chart from an article at ThinkAdvisor.

Source: Morningstar, ThinkAdvisor (click on image to enlarge)

Now, this chart is a little biased because it is looking at long periods of underperformance—3-year rolling periods—from managers that had top 10-year track records. In other words, these are exactly the kinds of managers you would hope to hire, and even they have long stretches of underperformance. When things are going well, clients are euphoric. Clients, though, often feel like even short periods of underperformance mean something is horribly wrong.

The entire article, written by Envestnet’s J. Gibson Watson, is worth reading because it makes the point that simply knowing about the underperformance is not very helpful until you know why the underperformance is occurring. Some underperformance may simply be a style temporarily out of favor, while other causes of underperformance might suggest an intervention is in order.

It’s quite possible to have a poor experience with a good manager if you bail out when you should hang in. Investing well can be simple, but that doesn’t mean it will be easy!

Posted by:


Quote of the Week

September 23, 2013

When most people say they want to be a millionaire, what they really mean is “I want to spend a million dollars,” which is literally the opposite of being a millionaire.—-Morgan Housel, Motley Fool

Saving and investing intelligently make you wealthy, not spending. I know—seems obvious—but that’s not how most people act.

Posted by:


Stocks for the Long Run

September 20, 2013

Unlike certain authors, I am not promoting some agenda about where stocks will be at some future date! Instead, I am just including a couple of excerpts from a paper by luminaries David Blanchett, Michael Finke, and Wade Pfau that suggests that stocks are the right investment for the long run—based on historical research. Their findings are actually fairly broad and call market efficiency into question.

We find strong historical evidence to support the notion that a higher allocation to equities is optimal for investors with longer time horizons, and that the time diversification effect is relatively consistent across countries and that it persists for different levels of risk aversion.

When they examine optimal equity weightings in a portfolio by time horizon, the findings are rather striking. Here’s a reproduction of one of their figures from the paper:

Source: SSRN/Blanchett, Finke, Pfau (click to enlarge)

They describe the findings very simply:

Figure 1 also demonstrates how to interpret the results we include later in Tables 2 and 3. In Figure 1 we note an intercept (α) of 45.02% (which we will assume is 45% for simplicity purposes) and a slope (β) of .0299 (which for simplicity purposes we will assume is .03). Therefore the optimal historical allocation to equities for an investor with a 5 year holding period would be 60% stocks, which would be determined by: 45% + 5(3%) = 60%.

In other words, if your holding period is 15-20 years or longer, the optimal portfolio is 100% stocks!

Reality, of course, can be different from statistical probability, but their point is that it makes sense to own a greater percentage of stocks the longer your time horizon is. The equity risk premium—the little extra boost in returns you tend to get from owning stocks—is both persistent and decently high, enough to make owning stocks a good long-term bet.

Posted by:


From the Archives: Inherently Unstable Correlations

September 19, 2013

No, this is not a post on personality disorders.

Rather, it is a post on the inherently unstable nature of correlations between securities and between asset classes. This is important because the success of many of the approaches to portfolio management make the erroneous assumption that correlations are fairly stable over time. I was reminded just how false this belief is while reading The Leuthold Group‘s April Green Book in which they highlighted the rolling 10-year correlations in monthly percentage changes between the S&P; 500 and the 10-year bond yield. Does this look stable to you? Chart is shown by permission from The Leuthold Group.

Correlation Inherently Unstable

(Click to Enlarge)

If you are trying to use this data, would you conclude that higher bond yields are good for the stock market or bad? The answer is that the correlations are all over the map. In 2006, William J. Coaker II published The Volatility of Correlations in the FPA Journal. That paper details the changes in correlations between 15 different asset classes and the S&P; 500 over a 34-year time horizon. To give you a flavor for his conclusions, he pointed out that Real Estate’s rolling 5-year correlations to the S&P; 500 ranged from 0.17 to 0.75, and for Natural Resources the range was -0.34 to 0.49. History is conclusive – correlations are unstable.

This becomes a big problem for strategic asset allocation models that use historical data to calculate an average correlation between securities or asset classes over time. Those models use that stationary correlation as one of the key inputs into determining how the model should currently be allocated. That may well be of no help to you over the next five to ten years. Unstable correlations are also a major problem for “financial engineers” who use their impressive physics and computer programming abilities to identify historical relationships between securities. They may find patterns in the historical data that lead them to seek to exploit those same patterns in the future (i.e. LTCM in the 1990′s.) The problem is that the future is under no obligation to behave like the past.

Many of the quants are smart enough to recognize that unstable correlations are a major problem. The solution, which I have heard from several well-known quants, is to constantly be willing to reexamine your assumptions and to change the model on an ongoing basis. That logic may sound intelligent, but the reality is that many, if not most, of these quants will end up chasing their tail. Ultimately, they end up in the forecasting game. These quants are rightly worried about when their current model is going to blow up.

Relative strength relies on a different premise. The only historical pattern that must hold true for relative strength to be effective in the future is for long-term trends to exist. That is it. Real estate (insert any other asset class) and commodities (insert any other asset class) can be positively or negatively correlated in the future and relative strength models can do just fine either way. Relative strength models make zero assumptions about what the future should look like. Again, the only assumption that we make is that there will be longer-term trends in the future to capitalize on. Relative strength keeps the portfolio fresh with those securities that have been strong relative performers. It makes no assumptions about the length of time that a given security will remain in the portfolio. Sure, there will be choppy periods here and there where relative strength models do poorly, but there is no need (and it is counterproductive) to constantly tweak the model.

Ultimately, the difference between an adaptive relative strength model and most quant models is as different as a mule is from a horse. Both have four legs, but they are very different animals. One has a high probability of being an excellent performer in the future, while the other’s performance is a big unknown.

—-this article originally appeared 4/16/2010. It’s important to understand the difference between a model that relies on historical correlations and a model that just adapts to current trends.

Posted by:


Tail Risk

September 18, 2013

Tail risk, or sometimes hedging tail risk, has been a hot topic lately. Tail risk is essentially the song of the black swan—it’s what happens when a negative event with a 1% probability happens. Ever since 2008, concern of being caught in another large market decline has caused investors to be very aware of tail risk. Tail risk has also engendered some very interesting exercises in portfolio construction, with all manner of alternative assets.

Consider, however, this from Javier Estrada’s recent paper, Rethinking Risk:

The evidence discussed here, based on a comprehensive sample of 19 countries over 110 years, suggests that investors that focus on uncertainty are likely to view stocks as riskier than bonds, and those that focus on long‐term terminal wealth are likely to view stocks as less risky than bonds even if they are concerned with tail risks. This is the case because, even when tail risks do materialize, investors are more likely to have a higher terminal wealth (that is, more capital at the end of the holding period) by investing in stocks than by investing in bonds.

In other words, a lot of your definition of risk depends on whether you view risk as uncertainty (volatility, standard deviation) or you are focused on terminal wealth—how much money you have at the end of the day.

Here’s another important excerpt:

Obviously, it is for nobody but the investor himself to say what lets him sleep at night. That being said, Charlie Munger, Warren Buffett’s longtime partner at Berkshire, has some advice for investors in the setting described. In fact, Munger (1994) argues that if “you’re investing for 40 years in some pension fund, what difference does it make if the path from start to finish is a little more bumpy or a little different than everybody else’s so long as it’s all going to work out well in the end? So what if there’s a little extra volatility.”

To be sure, there may be long‐term investors that simply cannot help being concerned with, and react to, the short‐term fluctuations in the value of their portfolios. And if that is the case, short‐term volatility is how they assess risk and little of what is discussed in this article may be relevant to them. That being said, would it not make sense to at least also worry about whether a conservative strategy will, by the end of the holding period, enhance purchasing power or underperform an aggressive strategy by a wide margin?

Granted, an investor may be fully aware that a conservative strategy is likely to underperform an aggressive one and still be happy with choosing the former if he is concerned with tails risks, such as a big loss close to the end of the holding period, or a holding period of very low stock returns, however unlikely they may be. And yet, should not this investor also consider whether he will be better off (that is, end with a higher terminal wealth) by pursuing an aggressive strategy even in the case that tail risks do materialize?

That last part is critical. It is clear that the longer is the holding period the more likely is a riskier strategy to outperform a less risky one; that is, in fact, what theory suggests and what the evidence shows. And yet some investors may stay away from an aggressive strategy simply out of fear of tail risks without grasping that, even if these risks do materialize, their terminal wealth is likely to be higher than with a conservative strategy.

Pretty interesting stuff. The author notes that there are times and conditions when concern with volatility could dominate, but if you are talking about a long investment period, the data shows that being overly conservative can impact terminal wealth more negatively than tail risk. (I added the bold.)

This is just another way to point out that the costs you can measure (volatility, drawdown) are often swamped by the cost you cannot measure directly—opportunity cost.

Despite being embedded into Modern Portfolio Theory, volatility might not be the only kind of risk that matters. (In fact, I’ve pointed out that one handy use of volatility is to add on dips. Volatility can be harnessed productively in certain situations.) I am not suggesting that risk management be tossed aside, but if your primary concern is terminal wealth, you need to think about portfolio construction in a nuanced way.

Posted by:


Running to Cash

September 18, 2013

When investors are fearful, they often run to cash to try to protect themselves. However, most investors are fearful at the wrong times, so often they protect themselves from gains. Josh Brown of The Reformed Broker wrote such a good piece on this that I just had to include his awesome checklist here!

I went to cash because (please check one):

1. Sequestration

2. The Taper

3. Obamacare

4. Debt Ceiling

5. Egypt Revolution

6. Portuguese Bond Auctions

7. US Elections

8. Syria Threat

9. Sharknado

10. Chinese GDP

11. London Whale

12. High Frequency Trading

13. Nasdaq Freeze

14. Grexit

15. Marc Faber web video appearance on cnbc.com

16. Larry Summers

17. Low Volume

18. CAPE Valuation

19. Hindenburg Omen

20. Death Cross

21. Other (please explain): _____________

I don’t think Mr. Brown is necessarily suggesting that cash is never a good idea, but he is poking a little fun at the many excuses investors use to raise cash to make themselves feel better.

If emotional investing is not a good idea, what should investors be doing? While this is not an exhaustive list, here are some thoughts that might make raising cash a little less random—including some other ways to deal with portfolio volatility.

  • consider that good diversification is one way to deal with occasional bouts of portfolio discomfort. We often talk about diversifying by volatility, by asset class, and by strategy.
  • consider the use of a long-term moving average to raise cash on individual securities or the overall market. Using a moving average is not likely to help your returns, but it typically reduces volatility.
  • consider making no major portfolio changes when the market is within 8-10% of its recent high. 8-10% fluctuations are normal, fairly frequent, and shouldn’t warrant wholesale portfolio changes.
  • consider using relative performance when it is time to reduce your exposure. In other words, sell what’s been performing the worst (instead of hoping it will rebound) and hold on to the strongest performers.

There’s no perfect way to manage a portfolio. Every investor makes plenty of mistakes along the way, but minimizing the negative effects of those mistakes can really help in the long run.

Posted by:


From the Archives: Mebane Faber’s New White Paper on Relative Strength

September 17, 2013

Mebane Faber recently released a nice white paper, Relative Strength Strategies for Investing, in which he tested relative strength models consisting of US equity sectors from 1926-2009. He also tested relative strength models consisting of global assets like foreign stocks, domestic stocks, bonds, real estate, and commodities from 1973-2009. The relative strength measures that he used for the studies are publicly-known methods based on trailing returns. Some noteworthy conclusions from the paper:

  • Relative strength models outperformed buy-and-hold in roughly 70% of all years
  • Approximately 300-600 basis points of outperformance per year was achieved
  • His relative strength models outperformed in each of the 8 decades studied

I always enjoy reading white papers on relative strength. It is important to mention that the methods of calculating relative strength that were used in Faber’s white paper are publicly-known and have been pointed to for decades by various academics and practitioners. Yet, they continue to work! Those that argue that relative strength strategies will eventually become so popular that they will cease to work have some explaining to do.

—-this article originally appeared 4/20/2010. Of course, the white paper is no longer new at this point, but it is a reminder of the durability of relative strength as a return factor. Every investing method goes through periods of favor and disfavor. Investors are, unfortunately, likely to abandon even profitable methods at the worst possible time. This paper is a good reminder that return factors are durable, but patience may be required to harvest those returns. Most often, the investor that sticks to it will be rewarded.

Posted by:


Hope for the Great Rotation?

September 13, 2013

Numerous market observers over the past few years have wondered about the timing of “the great rotation,” wherein investors would begin to rotate some of their massive bond holdings into the equity market. When would the great rotation happen, or would it happen at all?

There has been a big return differential in stocks and bonds—much in favor of stocks—since the market bottom in 2009, but that did not convince investors to leave the bond market. Stocks were doing great, but bonds were still going up.

Stock-Bond Return Differential since 2009 Bottom

(click on image to enlarge)

It’s only been quite recently that bond total returns have actually been negative. Maybe that will be the straw that breaks the camel’s back.

Stock-Bond Return Differential: Short-term View

(click on image to enlarge)

Dr. Ed Yardeni, an economist both respected and practical (which makes him very rare indeed!), suggests that we may possibly be seeing the beginnings of the great rotation. He writes:

Over the past 13 weeks through the week of August 28, the Investment Company Institute estimates that bond funds had net cash outflows totaling $438 billion at an annual rate. Over the same period, equity funds had net cash inflows of $92 billion at an annual rate. I wouldn’t describe that as a “Great Rotation” just yet, but it could be the start of a big swing by retail investors into equities.

He accompanied his note with a couple of graphics that are interesting.

Source: Dr. Ed’s Blog (click on image to enlarge)

Source: Dr. Ed’s Blog (click on image to enlarge)

Things could certainly go the other way—all we really have right now are green shoots—but the implications of a great rotation could be significant.

One big reason for that is the difference in relative size of the stock and bond markets. I looked at current SIFMA data on bonds outstanding and found it was about $38.6 trillion. Total market capitalization for the Wilshire 5000, a super-broad stock index, is about $19.9 trillion right now. Stocks are only about 34% of the capital markets. The total US bond market is almost twice as large! Even money that migrates from the margin of the bond market has the potential to move the stock market quite a bit. (Global capital markets are even more lopsided, with the bond market estimated to be about 3 times larger than the equity market.)

I don’t know if we will see the great rotation going forward, but if the markets get even a whiff that we will, it could be pretty fun.

Posted by:


Quote of the Week

September 13, 2013

There are now more hedge funds in the U.S. than there are Taco Bells. This explains why the average hedge fund manager is about as talented as a bean burrito.—-Morgan Housel, Motley Fool

Posted by:


From the Archives: The Imprecision of Value

September 12, 2013

One of the reasons that we like to use relative strength as a return factor is its precision, its lack of assumptions, and its universality–basically its ability to rank even very disparate assets.

Although value managers often discuss assets or stocks that are undervalued, there is little agreement on how value works. Take, for example, a Bloomberg story from today, entitled U.S. Stocks Cheapest Since 1990 on Analyst Estimates. With a title like that, you would expect an article that discusses how cheap stocks are relative to earnings. And, indeed, the article cites such a source:

“The stock market is incredibly inexpensive,” said Kevin Rendino, who manages $11 billion in Plainsboro, New Jersey, for BlackRock, the world’s largest asset manager. “I don’t know how the bears can argue against how well corporations are doing.”

Not only are stocks cheap, but analysts seem reluctant to buy in, something that strikes me, from a contrary opinion point of view, as unabashedly positive.

While analysts are raising estimates, they’re not boosting investment ratings. Companies ranked “buy” make up 30 percent of all U.S. equities, the data show. That compares with 45 percent in September 2007, a month before the S&P; 500 reached its record high of 1,565.15 and began a 17-month plunge that erased $11 trillion from the value U.S. shares.

But hold on a mintue– here is the part I find most fascinating about the article: no one can agree on the valuation. (I guess the tendency to cover both sides of the story in the same article comes from political opinion coverage, where the media thinks they have to give equal time to both sides, whether rational or not.)

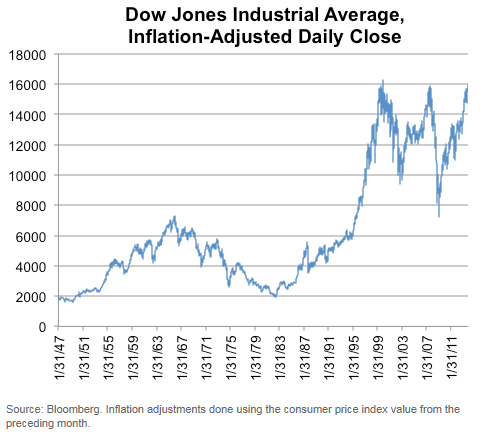
David Rosenberg, chief economist of Gluskin Sheff & Associates Inc., says U.S. stocks are poised for losses because they’ve become too expensive. The S&P; 500 is valued at 22.1 times annual earnings from the past 10 years, according to inflation-adjusted data since 1871 tracked by Yale University Professor Robert Shiller.

So while you have reputable analysts arguing that the market is cheap, you have equally reputable analysts arguing that the market is expensive! How does that happen? Well, it happens because everyone in the value camp operates from a (sometimes radically) different set of assumptions. Are you using trailing estimates, forward estimates, or 10-year normalized estimates? And, by the way, they are estimates.

Source: DenverPost.com

Relative strength is nice because it is precise. No one argues about what the trailing 6-month or 12-month return was. It’s cut and dried. Although different firms use slightly different relative strength calculations–Dorsey, Wright Money Management has a proprietary method–it is hard to imagine a scenario where there would be much disagreement about the strength or weakness of the same market.

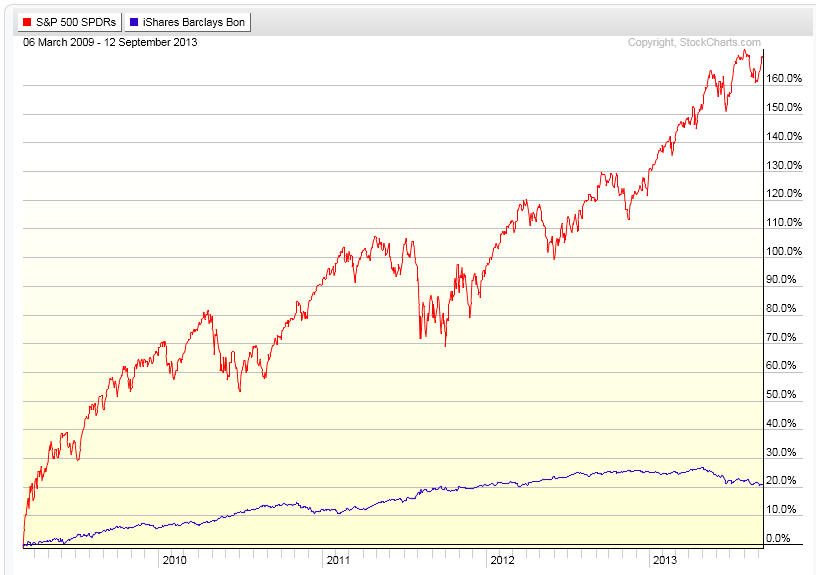
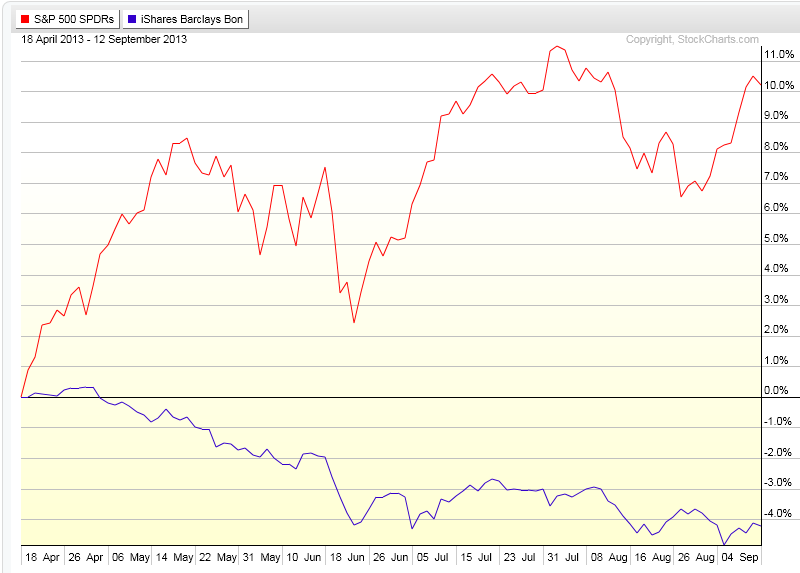
Which is stronger, U.S. stocks or U.S. long-term bonds? Just looking at a comparative chart of the two assets makes it obvious, even to someone not sophisticated in quantitative analysis (SPY vs. TLT).

Click to enlarge. Source: Yahoo! Finance

On the other hand, determining which asset is a better value is quite indeterminate. It all depends on whether you take as your starting point the view that the U.S. stock market is cheap or expensive!

And what happens when you have to value a multi-asset portfolio? How do you determine whether real estate, international stocks, euros, or emerging market bonds are cheaper? The lack of agreed-upon metrics between markets, let alone within an individual market, make this kind of decision a nightmare from a valuation perspective.

Since prior performance is precise, relative strength measurements can be made easily and without argument. Relative strength can easily be used for multi-asset portfolios as well. And finally, the returns from using the relative strength factor are high–as high as the returns from the value factor, and in many studies, higher. Luckily for us, efficient-market types normally decline to use relative strength because theoretically it shouldn’t work! Their loss is our gain.

—-this article originally appeared 4/26/2010. The broad market is up about 40% since this article was written and the debate about valuations is still raging! That alone should tell you that trying to figure out who is right—and whether to invest or not—is not a productive use of time. Relative strength simply indicates what the strongest markets are at any given time.

Posted by:


Buy and Hold

September 9, 2013

John Rekenthaler at Morningstar launched into a spirited defense of buy and hold investing over the weekend. His argument is essentially that since markets have bounced back since 2009, buy and hold is alive and well, and any arguments to the contrary are flawed. Here’s an excerpt:

There never was any logic behind the “buy-and-hold is dead” argument. Might it have lucked into being useful? Not a chance. Coming off the 2008 downturn, the U.S. stock market has roared to perhaps its best four and a half years in history. It has shone in absolute terms, posting a cumulative gain of 125% since spring 2009. It has been fabulous in real terms, with inflation being almost nonexistent during that time period. It’s been terrific in relative terms, crushing bonds, cash, alternatives, and commodities, and by a more modest amount, beating most international-stock markets as well. This is The Golden Age. We have lived The Golden Age, all the while thinking it was lead.

Critics will respond that mine is a bull-market argument. That’s backward. “Buy-and-hold is dead” is the strategy that owes its existence to market results. It only appears after huge bear markets, and it only looks good after such markets. It is the oddity, while buy-and-hold is the norm.

Generally, I think Morningstar is right about a lot of things—and Rekenthaler is even right about some of the points he makes in this article. But in broad brush, buy and hold has a lot of problems, and always has.

Here’s where Rekenthaler is indisputably correct:

  • “Buy and hold is dead” arguments always pop up in bear markets. (By the way, that says nothing about the accuracy of the argument.) It’s just the time that anti buy-and-holders can pitch their arguments when someone might listen. In the same fashion, buy and hold arguments are typically made after a big recovery or in the midst of a bull market—also when people are most likely to listen. Everyone has an axe to grind.
  • Buy and hold has looked good in the past, compared to forecasters. As he points out in the article, it is entirely possible to get the economic forecast correct and get the stock market part completely wrong.
  • The 2008 market crash gave the S&P; 500 its largest calendar year loss in 77 years. No doubt.

The truth about buy and hold, I think, is considerably more nuanced. Here are some things to consider.

  • The argument for buy and hold rests on hindsight bias. Historical returns in the US markets have been among the strongest in history over very long time periods. That’s why US investors think buy and hold works. If buy and hold truly works, what about Germany, Argentina, or Japan at various time periods? The Nikkei peaked in 1989. Almost 25 years later, the market is still down significantly. Is the argument, then, that only the US is special? Is Mr. Rekenthaler willing to guarantee that US returns will always be positive over some time frame? I didn’t think so. If not, then buy and hold is not a slam dunk either.
  • Individual investors have time frames. We only live so long. A buy and hold retiree in 1929 or 1974 might be dead before they got their money back. Same for a Japanese retiree in 1989. Plenty of other equity markets around the world, due to wars or political crises, have gone to zero. Zero. That makes buy and hold a difficult proposition—it’s a little tough mathematically to bounce back from zero. (In fact, the US and the UK are the only two markets that haven’t gone to zero at some point in the last 200 years.) And plenty of individual stocks go to zero. Does buy and hold really make sense with stocks?
  • Rejecting buy and hold does not have the logical consequence of missing returns in the market since 2009. For example, a trend follower would be happily long the stock market as it rose to new highs.
  • Individual investors, maddeningly, have very individual tolerances for volatility in their portfolios. Some investors panic too often, some too late, and a very few not at all. How that works out is completely path dependent—in other words, the quality of our decision all depends on what happens subsequently in the market. And no one knows what the market will do going forward. You don’t know the consequences of your decision until some later date.
  • In our lifetimes, Japan. It’s funny how buy and hold proponents either never mention Japan or try to explain it away. “We are not Japan.” Easy to say, but just exactly how is human nature different because there is an ocean in between? Just how is it that we are superior? (Because in 1989, if you go back that far, there was much hand-wringing and discussions of how the Japanese economy was superior!)

Every strategy, including buy and hold, has risks and opportunity costs. Every transaction is a risk, as well as an implicit bet on what will happen in the future. The outcome of that bet is not known until later. Every transaction, you make your bet and you take your chances. You can’t just assume buy and hold is going to work forever, nor can you assume it will stop working. Arguments about any strategy being correct because it worked over x timeframe is just a good example of hindsight bias. Buy and hold doesn’t promise good returns, just market returns. Going forward, you just don’t know—nobody knows. Yes, ambiguity is uncomfortable, but that’s the way it is.

That’s the true state of knowledge in financial markets: no one knows what will happen going forward, whether they pretend to know or not.

Posted by:


Investment Process versus Investment Performance

September 6, 2013

Marshall Jaffe wrote an excellent article on investment process versus investment performance in the most recent edition of ThinkAdvisor. I think it is notable for a couple of reasons. First, it’s pithy and well-written. But more importantly, he’s very blunt about the problems of focusing only on investment performance for both clients and the industry. And make no mistake—that’s how the investment industry works in real life, even though it is a demonstrably poor way to do things. Consider this excerpt:

We see the disclaimer way too often. “Past performance is no guarantee of future results.” It is massively over-used—plastered on countless investment reports, statements and research. It’s not simply meaningless; it’s as if it’s not even there. And that creates a huge problem, because the message itself is really true: Past performance has no predictive value.

Since we are looking for something that does have predictive value—all the research, experience and hard facts say: Look elsewhere.

This is not a controversial finding. There are no fringe groups of investors or scholars penning op-ed pieces in the Wall Street Journal shooting holes in the logic of this reality. Each year there is more data, and each year that data reconfirms that past performance is completely unreliable as an investment tool. Given all that, you would think it would be next to impossible to find any serious investors still using past performance as a guideline. Indeed, that would be a logical conclusion.

But logical conclusions are often wrong when it comes to understanding human behavior. Not only does past performance remain an important issue in the minds of investors, for the vast majority it is the primary issue. In a study I referred to in my August column, 80% of the hiring decisions of large and sophisticated institutional pension plans were the direct result of outstanding past performance, especially recent performance.

The truth hurts! The bulk of the article discusses why investors focus on performance to their detriment and gives lots of examples of top performers that focus only on process. There is a reason that top performers focus on process—because results are the byproduct of the process, not an end in themselves.

The reason Nick Saban, our best athletes, leading scientists, creative educators, and successful investors focus on process is because it anchors them in reality and helps them make sensible choices—especially in challenging times. Without that anchor any investor observing the investment world today would be intimidated by its complexity, uncomfortable with its volatility and (after the meltdown in 2008) visibly fearful of its fragility. Of course we all want good returns—but those who use a healthy process realize that performance is not a goal; performance is a result.

Near the end of the article, I think Mr. Jaffe strikes right to the core of the investment problem for both individual investors and institutions. He frames the right question. Without the right question, you’re never going to get the right answer!

In an obsessive but fruitless drive for performance too many fund managers compromise the single most important weapon in their arsenal: their investment process.

Now we can see the flaw in the argument that an investor’s basic choice is active or passive. An investor indeed has two choices: whether to be goal oriented or process oriented. In reframing the investment challenge that way, the answer is self-evident and the only decision is whether to favor a mechanical process or a human one.

Reframing the question as “What is your investment process?” sidelines everything else. (I added the bold.) In truth, process is what matters most. Every shred of research points out the primacy of investment process, but it is still hard to get investors to look away from performance, even temporarily.

We focus on relative strength as a return factor—and we use a systematic process to extract whatever return is available—but it really doesn’t matter what return factor you use. Value investors, growth investors, or firms trying to harvest more exotic return factors must still have the same focus on investment process to be successful.

If you are an advisor, you should be able to clearly explain your investment process to a client. If you are an investor, you should be asking your advisor to explain their process to you. If there’s no consistent process, you might want to read Mr. Jaffe’s article again.

HT to Abnormal Returns

Posted by: