December 9, 2012
If you need another reason to hate the French, besides envy of their excellent cuisine, it turns out that a bevy of winemakers were fined and given suspended sentences for foisting cheap, lousy wine on American consumers and charging them premium prices for it.
On the other hand, it shows that cognitive biases are everywhere. Neither the American company the wine was shipped to nor consumers drinking it ever complained! Because the wine was labeled as premium pinot noir, wine enthusiasts apparently thought it tasted great. In fact, it turns out that wine drinkers think expensive wine tastes better, even when you trick them and give them two glasses of wine from the same bottle.
This behavior is not unknown in the stock market, where cognitive biases run unbridled down Wall Street. Ten years ago, everyone was in love with General Electic. It, too, was high-priced and tasted great. Ten years later, GE is considered cheap swill that leaves a bitter taste in the mouths of investors.

The moral of the story is that you can’t fall in love with your stocks or your wine. You have to like it on its own merits. In the case of our Systematic RS accounts, we like a stock only as long as it has high relative strength. When it becomes weaker and drops in its ranking–indicating that other, stronger stocks are available–we sell it and move on to a better class of grape. (We’ve been known to break a bottle here and there, but the idea is to adapt as tastes change.) In this way, we strive to keep our wine cellar stocked with the best vintages all the time.

—-this article originally appeared 2/19/2012. Cognitive biases are still running wild on Wall Street.
 Comments Off on From the Archives: Zut Alors! |
  From the Archives, Investor Behavior, Just for Fun, Markets, Thought Process | Tagged: investor behavior, relative strength |
  Permalink

Posted by:
Mike Moody
October 30, 2012
Does human behavior evolve or is human nature relatively unchanging? A recent Wall Street Journal article by Jason Zweig made the case for human nature as relatively stable when it discussed the results of a fascinating study. Here’s the back story:
A fascinating new research paper analyzes how individual investors built stock portfolios soon after building portfolios first became possible: from 1690 to 1730.
The researchers, led by the distinguished financial historian Larry Neal of the University of Illinois, painstakingly replicated all the holdings and trades in the Bank of England, the East India Co. and the United East India Co., the Royal African Co., the Hudson’s Bay Co., the Million Bank and the South Sea Co. These were the dominant companies at the birth of the British capital markets three centuries ago. The share registries survive, so the scholars were able to match virtually every investment with the person who held it – encompassing 5,813 investors during the 1690s and 23,723 by the end of the period.
As a result, the way portfolios were constructed around 1700 can be compared to the way investors construct portfolios now. Mr. Zweig writes:
Three centuries ago, investors:
- underdiversified, with 86% of them owning shares in only a single stock;
- chased performance, with rising prices leading to higher trading volume;
- underperformed the market as a whole, earning lower returns and incurring higher risk.
There’s little evidence of change in human nature now.
Investors today:
He concludes that:
The research findings on investors in the early days of the British stock market should remind us all that human nature is the same today as it was in the days of clay pipes, quill pens and horse-drawn carriages.
The investing crowd is as foolish now as it was then – or perhaps more so, considering that foolishness can spread faster over Twitter and smartphones than it could by foot through cobblestone streets.
In order to be a superior investor, you have to combat the crazy ideas of those around you and, above all, fight the hobgoblins in your own head. That was true in 1720. It is at least as true in 2012 as it was then.
Human nature is not an easy opponent for investors. We can’t run away from it because it is part of who we are. As a result, however, return factors that are based on human nature, like relative strength and value, are unlikely to change. That knowledge, at least, is somewhat comforting.
1 Comment | Investor Behavior, Markets | Tagged: human nature, investor behavior, relative strength | Permalink
Posted by:
Mike Moody
October 26, 2012
Martjin Cremers, a professor at Yale, and his colleague, Antti Petajisto, authored a paper on the concept of active share. Advisor Perspectives recently interviewed Mr. Cremers to ask about his research. (This link is worth checking out, as it has links to additional articles such as From Yale University: New Research Confirms the Value of Active Management and Compelling Evidence That Active Management Really Works.)
Active share is a holdings-based measure of how different the holdings in an active portfolio are from the benchmark portfolio. As an example, an S&P; 500 index fund would have an active share of 0%, since the holdings would be identical to the benchmark. Portfolios with low active shares around 20-60% are still so close to the benchmark that they are considered closet indexers.
Where Cremers and Petajisto differ from the establishment is that by segmenting managers in this way, they believe they are able to identify a subset of managers–those with high active share–who can outperform the benchmark over time.
That result is probably the most controversial. We find significant evidence, in our view, that a lot of managers actually do have some skill.
What I find refreshing about their approach is their willingness to examine aggregate data more thoroughly. In aggregate, their data also shows that fund managers do not outperform the benchmark. Most studies stop there, pretend not to notice that numerous tested factors show evidence of long-term outperformance, and then advise investors to buy index funds and to forget about active management.
Cremers and Petajisto were not content to take the lazy road. And, in fact, when looked at in more granular fashion, the data tells a different story. Closet indexers do worse than the market, but many managers with high active share show evidence of skill. This is much more in accord with other academic research that shows that broad, robust factors like relative strength and deep value can outperform over time. A manager that pursued such a strategy would have high active share and would have a good chance of long-term outperformance. That’s exactly what our systematic relative strength strategies are designed to do.
—-this article originally appeared 2/10/2010. Last week, another well-known pundit was advancing the results of their study, which showed that managers do not outperform the market. They also took the lazy road, claiming that investors should just buy index funds. The truth is more nuanced, as Cremers and Petajisto show. There are several tested return factors that show long-term outperformance, such as value and relative strength. Managers pursuing a factor-based strategy would be likely to have high active share, and according to Cremers and Petajisto, might be just the type of manager that shows evidence of significant skill.
3 Comments | Markets, Relative Strength Research, Thought Process | Tagged: active share, relative strength | Permalink
Posted by:
Mike Moody
October 18, 2012
We use relative strength (known as “momentum” to academics) in our investment process. We’ve written extensively how complementary strategies like low volatility and value can be used alongside relative strength in a portfolio. S&P; is now on board the train, as they show in this research paper how alternative beta strategies are often negatively correlated. In fact, here’s the correlation matrix from the paper:
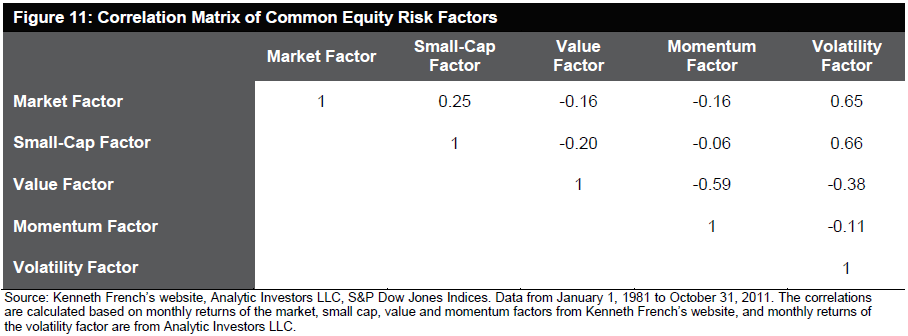
Source: Standard & Poors (click to enlarge image)
You can see that relative strength/momentum is negatively correlated with both value and low volatility. This is why we prefer diversification through complementary strategies.
They conclude:
…combining alternative beta strategies that are driven by distinct sets of risk factors may help to reduce the active risk and improve the information ratio.
Diversification is important for portfolios, but it’s not easily achieved. For example, if you decide to segment the market by style box rather than by return factors, you will find that the style boxes are all fairly correlated. Although it’s a mathematical truism that anything that isn’t 100% correlated will help diversification, diversification is far more efficient when correlations are low or negative.
We think using factor returns to identify complementary strategies is one of the more effective keys to diversification.
Comments Off on Complementary Strategies: One Key to Diversification | Markets, Portfolio Theory, Thought Process | Tagged: diversification, portfolio theory, relative strength, return factors, strategies | Permalink
Posted by:
Mike Moody
October 8, 2012
Inflation has been a big fear in the investment community for a few years now, but so far nothing has happened. An article at AdvisorOne suggests that the onset of inflation can sometimes be rapid and unexpected.
Someday, in the possibly near future, you will suddenly be paying $10 for a gallon of milk and wondering how the heck it happened so fast.
That is the strange and terrible way of inflation, said State Street Global senior portfolio manager Chris Goolgasian in a panel talk on Thursday at Morningstar ETF Invest 2012. Inflation has a way of appearing to be a distant threat before it sneaks up suddenly and starts driving prices through the roof.
Quoting from Ernest Hemingway’s novel “The Sun Also Rises,” Goolgasian took note of a passage where a man is asked how he went bankrupt. “Two ways,” the man answered. “Gradually, then suddenly.”
“The danger is in the future, and it’s important to manage portfolios for the future,” Goolgasian concluded. “Real assets can give you some assurance against that chance.”
That’s good to know—but which real assets, and when? After all, Japanese investors have probably been waiting for the inflation bogeyman for the last two decades. This is one situation in which tactical asset allocation driven by relative strength can be a big help. If you monitor a large number of asset classes continuously, you can identify when any particular real asset starts to surge in relative performance.
For example, on the Dorsey Wright database, the last extended run that gold had as a high relative strength asset class (ETF score > 3) was from 3/9/2011 to 12/21/2011. Below, I’ve got a picture of the ETF score chart, along with a performance snip during that same period. Perhaps because of investor concern about inflation—misplaced, as it turned out—gold outperformed fixed income over that stretch of time.
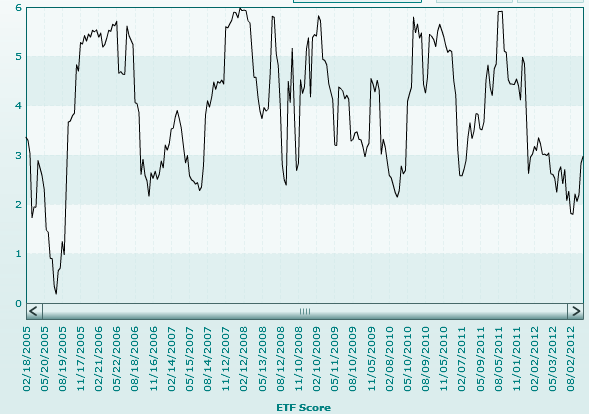
ETF Score for GLD
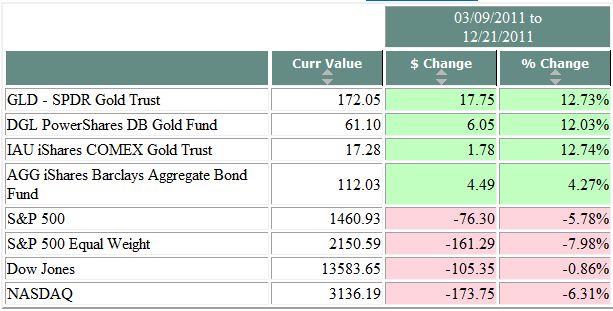
2011 Performance Snip
Source: Dorsey Wright (click on images to enlarge)
There’s no guarantee that gold will be an inflation hedge, of course. We never know what asset class will become strong when investors fear future inflation. Next time around it could be real estate, Swiss francs, TIPs, or energy stocks—or nothing. There are so many variables impacting performance that it is impractical (and impossible) to account for them all. However, relative strength has the simple virtue of pointing out—based on actual market performance—where the strength is appearing.
Investment history sometimes seems to be a never-ending cycle of discredited themes, but those themes can drive the market quite powerfully until they are discredited. (Remember the “new era” of the internet? Or how “peak oil” was so compelling with crude at $140/barrel?) It’s helpful to know what those themes are, whether you are trying to take advantage of them or just trying to get out of the way.
Comments Off on Inflation Also Rises | Markets, Tactical Asset Alloc, Thought Process | Tagged: inflation, investor, relative strength, Tactical Asset Allocation | Permalink
Posted by:
Mike Moody
September 27, 2012
Adam Davidson’s article “Hey, Big Saver!” in the New York Times is an excellent summary of the competing arguments on the merits of QE3. There truly are compelling arguments for why this will work and there are compelling arguments why it won’t. Effectiveness aside, Bernanke has made his intentions perfectly clear:
When Bernanke announced that the Fed would be investing in the mortgage market indefinitely, he signaled that he’s had it with short-term fixes. His Fed is committed, he said, to taking extraordinary measures until unemployment goes down. In Fed-speak, Q.E. 3 is a clear message to banks, investors and private companies that the economy is going to grow, and the riskiest thing they can do is to hold on to their cash and riskless securities and watch their competitors profit.
Are his policies working or not? This is why I love technical analysis. Rather than get caught up in theoretic debates, technical analysis cuts to the chase and asks a different question: What stocks, sectors, and asset classes have the best relative strength? Based on that information, relative strength investors can orient their portfolio to capitalize on those trends.
Investors are not interested in winning theoretical debates. Investors are interested in making money! Rather than focusing on what the Fed, Congress, the President, the ECB, banks, consumers, economists, investment strategists, your brother-in-law… have to say about what is going to happen in the market, take the pragmatist’s approach and let relative strength dictate your investment decisions.

Source: CBS News
HT: Real Clear Markets
2 Comments | Thought Process | Tagged: decision-making, relative strength | Permalink
Posted by:
Andy Hyer
September 19, 2012
From the Bank of International Settlements, research that confirms what Ken Rogoff has been telling us all along. Here’s the abstract:
At moderate levels, debt improves welfare and enhances growth. But high levels can be damaging. When does debt go from good to bad? We address this question using a new dataset that includes the level of government, non-financial corporate and household debt in 18 OECD countries from 1980 to 2010. Our results support the view that, beyond a certain level, debt is a drag on growth. For government debt, the threshold is around 85% of GDP. The immediate implication is that countries with high debt must act quickly and decisively to address their fiscal problems. The longer-term lesson is that, to build the fiscal buffer required to address extraordinary events, governments should keep debt well below the estimated thresholds. Our examination of other types of debt yields similar conclusions. When corporate debt goes beyond 90% of GDP, it becomes a drag on growth. And for household debt, we report a threshold around 85% of GDP, although the impact is very imprecisely estimated.
You can read the whole paper here.
Households really aren’t any different. High levels of debt can impact their solvency also, and threats should be addressed quickly and decisively. Likewise, it’s a good idea to have a fiscal buffer for emergencies.
I’m not sure how quickly and decisively Congress is dealing with national fiscal issues, but you have control of your own response at the household level.
It’s pretty clear that there will be significant investment implications from high levels of debt, whether at the sovereign or corporate level. It’s not clear exactly what those implications will be. In fact, there is still a lot of disagreement about whether taking on more debt in QE3 will help the economy or hurt it. While we have a chance to see if Mr. Rogoff’s theory works in the real world, investors might do well to heed the message sent by relative strength. Theory is interesting, but it may be more profitable to see which asset classes get stronger as a result of continued easing.
Comments Off on The Real Effects of Debt | Markets | Tagged: debt, economics, Ken Rogoff, relative strength, wealth management | Permalink
Posted by:
Mike Moody
September 17, 2012
Michael Sivy has a think piece on inflation in Time Magazine. His premise is that, based on what economists think they know about deficit spending, economic stimulus, and money creation, we should be having serious inflation. But so far that hasn’t happened.
The economy of the past three years has puzzled experts and policy makers in all sorts of ways, but the greatest mystery has been the recent decline in the rate of inflation. That may not seem remarkable in a stagnant economy, except that all the major economic theories suggest that prices should now be rising at a fast clip.
What’s most striking today is that all three of these factors are now at extremes that should be fanning the flames of inflation. Deficits of more than a trillion dollars a year are the highest in history. At close to zero, short-term interest rates are at their lowest level in more than 30 years. And the Fed’s monetary base has been expanding at an unprecedented rate. The remarkable thing is that none of this is translating into serious inflation. Over the past three years, some volatile prices, such as those for food and gasoline, have indeed gone up. But there still haven’t been sustained widespread price increases throughout the economy.
Mr. Sivy has a preferred explanation for this inflation mystery, and also suggests what may happen when things change.
The explanation is that all the money in the world won’t push up prices unless people are willing and able to spend it. So the dog that didn’t bark in this story is the money that didn’t get spent.
The current stagnation may simply have to run its course. But once it does and the economy really begins to rebound, it could well be accompanied by a surprisingly fast resurgence of inflation.
I think his viewpoint is worth considering. Inflation hasn’t been a problem so far, but that doesn’t mean it will never become a problem. Investors, many with bond-heavy portfolios, may be ill-equipped to deal with a bout of inflation. If inflation does occur, it may catch a lot of investors off guard, if only because they have seen declining inflation over their entire investing careers.
Relative strength might be a useful guide to solving the inflation mystery. If traditional inflation-sensitive assets like commodities or energy and basic materials stocks start to pick up significant relative strength versus other asset classes, it might be time to focus on portfolio protection.
1 Comment | Markets, Tactical Asset Alloc, Thought Process | Tagged: inflation, relative strength, Tactical Asset Allocation | Permalink
Posted by:
Mike Moody
September 12, 2012
Most professionals have noticed the move to ETFs happening, but a recent article at AdvisorOne makes the magnitude of the shift more clear:
Since the beginning of 2012, investors have pulled almost $15 billion from U.S. stock funds, while boosting money put into ETFs by $16 billion, according to industry studies.
In the latest AdvisorBenchmarking report, for example, 54% of advisors say they are likely to increase their use of the ETFs in the near future, with 43% saying they expect their use of ETFs over the next three years to remain the same.
What is the strategic role of ETFs in portfolios? According to the survey, many strategies lie behind ETF implementation. While “core” and “sector” exposures were most common, several other approaches were all within a few points of each other, including: alternatives exposure, directional market positions, factor or asset class exposures and country/region exposure. Clearly, ETFs are providing advisors and investors with attractive options for expressing their views, and that is translating into strong, consistent growth for these vehicles.
AdvisorBenchmarking provided a nice graphic on the strategic uses of ETFs. It’s clear that ETFs are multipurpose vehicles because advisors are using them to meet a lot of different objectives!
Source: AdvisorBenchmarking/AdvisorOne (click on image to enlarge)
According to their survey, only 8% of ETF use is coming from directional market positions—far less than imagined by people who criticize ETF investors as reckless market timers. For the most part, advisors are using ETFs to get exposures that were unavailable before, whether it is to a specific sector, country, or asset class.
Most of the ETFs now available offer passive exposures to various indexes. More interesting to me are the small number of semi-active ETFs that are designed to provide factor exposure in an attempt to generate alpha. Research suggests that combining factor exposures might be a superior way to capture market returns.
The Technical Leaders indexes are constructed to provide exposure to the momentum (relative strength) factor and there are a couple of low-volatility ETFs around as well. There are a few ETFs explicitly designed for value exposure, although I don’t think this area has been well-exploited yet. (I’m sorry to see Russell close down their suite of ETFs, which I thought had a lot of promise.)
With more and more options available to advisors, I would not be surprised to see ETF use continue to surge.
Comments Off on Advisors Turning to ETFs | Markets, Thought Process | Tagged: etf, ETFs, factor investing, momentum, relative strength, return factors | Permalink
Posted by:
Mike Moody
September 4, 2012
This just in from Institutional Investor: many backtests fail in real life. They write:
Makers of indexes often fill in the blanks with historic data on the components to produce hypothetical index performance. But a recent Vanguard study found that a large percentage of these hypothetical, back-filled indexes that had outperformed the U.S. stock market didn’t keep up after they went live as the index returns subsequently fell. What may be happening, says senior Vanguard ETF strategist Joel Dickson, is that indexes are being developed by “rearview mirror investing,” that is, through selection bias of what worked well in the past. The result can mean a nasty surprise for investors.
Duh.
Pretty much anyone can do data mining with the computing power available on a desktop computer. And index providers will continue to do data mining as long as investors ram money into products with lousy backtests.
Back-filled index funds attract on average twice the cash flow in the initial launch phase than funds with new indexes that don’t have such data, indicating that the availability of a track record makes the fund more attractive — even if it probably won’t last.
Good backtesting can be very useful and can give investors a good idea of what to expect in the future. But how can an investor tell if the backtest is any good or not?
One thing to examine is how robust the index methodology is. For example, when we built our Systematic Relative Strength products, we subjected them to Monte Carlo testing for robustness. That made it apparent that the systematic investment method itself was sound, even though the range of outcomes on a quarterly or annual basis can be significant.
With the proliferation of indexes for ETFs, it’s becoming important to be able to evaluate how robust the backtesting was. Probably partly because of a robust backtesting process, our Technical Leaders Index has outperformed the market since inception. I’m sure many other indexes are thoughtfully constructed—but I’m just as sure that there are some that are not.
Do your homework before you put client money at risk.
See www.powershares.com for more information. Past performance is no guarantee of future returns. A list of all holding for the previous 12 months is available upon request.
Comments Off on Fun With Backtesting | Investor Behavior, Markets, Relative Strength Research | Tagged: backtesting, data mining, etf, monte carlo testing, PDP, relative strength, systematic investment process | Permalink
Posted by:
Mike Moody
August 31, 2012
Andrew Ang of Columbia Business School has an important new paper out on SSRN. In it, he discusses mean variance optimization, the cornerstone of Modern Portfolio Theory. Unlike many other treatments in which portfolio construction through mean variance optimization is taken as gospel, Mr. Ang actually tests mean variance optimization against a wide variety of other diversification methods. This is the first article that I have seen that actually tries to put numbers to mean variance optimization. Here’s how he lays out his horserace:
I take four asset classes: U.S. government bonds (Barcap U.S. Treasury), U.S. corporate bonds (Barcap U.S. Credit), U.S. stocks (S&P; 500), and international stocks (MSCI EAFE), and track performance of various portfolios from January 1978 to December 2011. The data are sampled monthly. The strategies implemented at time t are estimated using data over the past five years, t-60 to t. The first portfolios are formed at the end of January 1978 using data from January 1973 to January 1978. The portfolios are held for one month, and then new portfolios are formed at the end of the month. I use one-month T-bills as the risk-free rate. In constructing the portfolios, I restrict shorting down to -100% on each asset.
He tests a wide variety of diversification methods. As usual, simple is often better. Here’s his synopsis of the results:
Table 14 reports the results of the horserace. Mean-variance weights perform horribly. The strategy produces a Sharpe ratio of just 0.07 and it is trounced by all the other strategies. Holding market weights does much better, with a Sharpe ratio of 0.41. This completely passive strategy outperforms the Equal Risk Contributions and the Proportional to Sharpe Ratio portfolios (with Sharpe ratios of 0.32 and 0.45, respectively). Diversity Weights tilt the portfolio towards the asset classes with smaller market caps, and this produces better results than market weights. The simple Equal Weight strategy does very well with a Sharpe ratio of 0.54. What a contrast with this strategy versus the complex mean-variance portfolio (with a Sharpe ratio of 0.07)! The Equal Weight strategy also outperforms the market portfolio (with a Sharpe ratio of 0.41). De Miguel, Garlappi and Uppal (2009) find that the simple 1/N rule outperforms a large number of other implementations of mean-variance portfolios, including portfolios constructed using robust Bayesian estimators, portfolio constraints, and optimal combinations of portfolios which I covered in Section 4.2. The 1/N portfolio also produces a higher Sharpe ratio than each individual asset class position.
That’s a lot to absorb. If we remove the academic flourishes, what he is saying is that mean variance optimization is dreadful and is easily outperformed by simply equal-weighting the asset classes. He references Table 14 of his paper, which I have reproduced below.
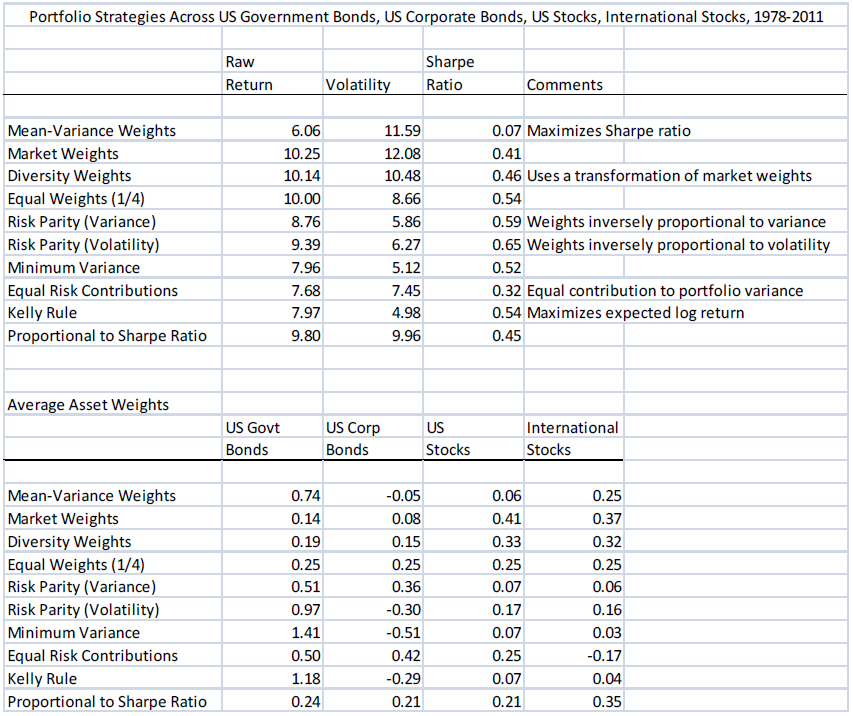
Table 14 Source: Andrew Ang/SSRN
(click to enlarge to full size)
(He points out later in the text that although risk parity approaches generate a slightly higher Sharpe ratio than equal weighting, it is mostly due to bonds performing so well over the 1978-2011 time period, a period of sharply declining interest rates. Like most observers of markets, he would be surprised to see interest rates decline dramatically from here, and thus thinks that the higher Sharpe ratios may be unsustainable. Mr. Ang also mentions in the article that using a five-year estimation period isn’t ideal, but that using 20-year or 50-year data is no better.)
I find it ironic that although mean variance optimization is designed to maximize the Sharpe ratio—to generate the most return for the least volatility—in real life it generates the worst results. As Yogi Berra said, in theory, theory and practice are the same. In practice, they aren’t!
Mr. Ang also asks and answers the question about why mean variance optimization does so poorly.
The optimal mean-variance portfolio is a complex function of estimated means, volatilities, and correlations of asset returns. There are many parameters to estimate. Optimized mean-variance portfolios can blow up when there are tiny errors in any of these inputs. In the horserace with four asset classes, there are just 14 parameters to estimate and even with such a low number mean-variance does badly. With 100 assets, there are 5,510 parameters to estimate. For 5,000 stocks (approximately the number listed in U.S. markets) the number of parameters to estimate is over 12,000. The potential for errors is enormous.
I put the fun part in bold. Tiny errors in estimating returns, volatilities, or correlations can cause huge problems. Attempting to estimate even 14 parameters ended in abject failure. We’ve written numerous pieces over the years about the futility of forecasting, yet this is exactly the process that Harry Markowitz, the father of Modern Portfolio Theory, would have you take!
Good luck with that.
To me, the implications are obvious. Diversification is always important, as it is a mathematical truism that combining any two assets that are not perfectly correlated will reduce volatility. But simple is almost always better. Mr. Ang draws the same conclusion. He writes:
Common to all these portfolio strategies is the fact that they are diversified. This is the message you should take from this chapter. Diversification works. Computing optimal portfolios using full mean-variance techniques is treacherous, but simple diversification strategies do very well.
The “simple is better” idea is not limited to asset class diversification. I think it also extends to diversification by investment strategy, like relative strength or value or low volatility. There’s an underlying logic to it—simple is better, because simple is more robust.
Some investors, it seems, are always chasing the holy grail or coming up with complicated theories that are designed to outperform the markets. In reality, you can probably dispense with all of the complex theory and use common sense. Staying the course with an intelligently diversified portfolio over the long term is probably the best way to reach your investing goals.
28 Comments | Markets, Tactical Asset Alloc, Thought Process | Tagged: mean variance optimization, modern portfolio theory, relative strength | Permalink
Posted by:
Mike Moody
August 30, 2012
So far, 2012 has been an excellent year for the PowerShares DWA Technical Leaders Index (PDP). Year-to-date, PDP is +14.94%, while the S&P; 500 is +12.16%. PDP, which began trading on March 1, 2007, is a big source of pride for our firm as it has outperformed its benchmark in every year since its inception except for one. For those unfamiliar with the strategy, the index is comprised of 100 high relative strength stocks and is reconstituted on a quarterly basis.
In every quarterly reconstitution there are stocks that come and stocks that go. Those that retain their strong relative strength stay, and those that have deteriorated are replaced. Interestingly, there are a number of stocks that have remained in the index since its inception over five years ago, including Apple Computer.
As shown above, the S&P; 500 (red line) has gone nowhere, while Apple Computer (blue line) has powered higher. Apple is currently the biggest weight in the index:
Obviously, not all of our holdings work out as well as Apple. However, capturing a few of these big winners can make a big difference.
As we announced just a short time ago, our Technical Leaders Index family was recently expanded to include DWAS, the PowerShares DWA Small-Cap Technical Leaders Index. Now, it is a family of four: PDP, PIE, PIZ, and DWAS.
See www.powershares.com for more information. Past performance is no guarantee of future returns. A list of all holdings for the last 12 months is available upon request.
Comments Off on Checking In On PDP | Markets | Tagged: etf, PDP, powershares, relative strength | Permalink
Posted by:
Andy Hyer
August 15, 2012
How do you judge the merits of momentum? Gary Antonacci says there are three ways to evaluate any investment opportunity:
- The first is to require that the method make sense. Is it in tune with the nature of the markets?
- The second criterion for accepting a new investment approach is robustness.
- The final way of judging robustness is by seeing how well an approach holds up in multiple markets and time periods, as well as with different parameter values.
The whole article is worth the read, but on the subject of robustness, Antonacci states the following:
Momentum is one of the most robust approaches ever explored in terms of its applicability and reliability. Following the 1993 seminal study by Jegadeesh and Titman, there have been nearly 400 published momentum papers, making it one of the most heavily researched finance topics over the past twenty years. Extensive research has shown that price momentum works in virtually all markets and all times periods from Victorian ages up to the present. It also has performed well using a wide range of look back periods.
There will always be doubters and those too impatient to capitalize, but the data supporting momentum is pretty hard to refute.
Note: Longtime readers will recognize that relative strength is known as “momentum” in the academic community.
2 Comments | Relative Strength Research | Tagged: momentum, relative strength, robust investment approaches | Permalink
Posted by:
Andy Hyer
August 14, 2012
The proverbial wisdom is that it is a character flaw to be unable to view “the forest for the trees.” However, from an investor’s perspective, sometimes granularity can be a virtue. There are any number of data points that reveal that investor sentiment is sub-par, including our own bi-weekly survey. Retail investors continue to pull money out of domestic equity funds and put it into fixed income. Consumer confidence is low. The economy both here and in many developed economies is stagnant.
Investors often make the mistake of evaluating the economy and financial markets in a monolithic fashion. However, it is significantly more complicated than that. Even in a lukewarm economy, there are micro-bull markets taking place right under our nose. One way of observing this reality is to look at the YTD performance of the 100 stocks that currently comprise the PowerShares DWA Technical Leaders Index. PDP is the ticker of the ETF that tracks this index.
Within this index, there are currently 27 stocks up more than 30% YTD (some up as much as 70-80% YTD) and the median YTD performance of stocks in the index is +18%. Through 8/13/12, PDP is up 12.30% YTD, outperforming the S&P; 500. In fact, PDP has performed favorably compared to the S&P; 500 in this bull market and and since inception.
So, where are some of the micro-bull markets taking place? Consider the business of the Skyworks Solutions (SWKS)–the index constituent that currently has the best YTD performance:
Skyworks Solutions, Inc., together with its subsidiaries, offers analog and mixed signal semiconductors worldwide. The company provides power amplifiers and front-end solutions for cellular handsets from entry level to multimedia platforms, as well as smart phones.
Source: The Street
In full disclosure, not all of the constituents of the PowerShares DWA Technical Leaders Index are performing well. This index is re-constituted quarterly with high relative strength stocks. Sometimes, strong stocks are added to the index and they perform abysmally. Sometimes the index as a whole underperforms. The point of this article is not to say that relative strength is a panacea. That said, there is solid research that shows that relative strength has been an effective way to beat the market over time. Furthermore, the index construction process ensures that the process seeks to identify individual winners regardless of the macro environment.
Not all trees in a forest are the same.
Image source: Confused Capitalist
See www.powershares.com for more information. Dorsey Wright also currently owns SWKS in our separately managed accounts. Past performance is no guarantee of future returns. A list of all holding for the previous 12 months is available upon request.
1 Comment | Markets, Thought Process | Tagged: PDP, relative strength, see the forest for the trees, stock selection, technical leaders index | Permalink
Posted by:
Andy Hyer
July 25, 2012
We’ve just released a small-cap ETF with PowerShares (DWAS), which is the first U.S. relative strength small-cap ETF. We’ve done our own testing, of course, but it might also be instructive to take a look at other small-cap relative strength returns. Once again, we used the Ken French data library to calculate annualized returns and standard deviation. The construction of their relative strength index is explained here. The difference this time around is that we used small-cap stocks instead of large-cap stocks. Generally speaking, a small-cap stock is one whose price times number of outstanding shares (market capitalization) is between $300 million and $2 billion. However, the Ken French data used also includes micro-cap stocks which have an even smaller market capitalization (typically between $50-$300 million). Market cap is above $10 billion for large-cap stocks.

In the past, small-cap stocks have yielded high returns. They often perform well because companies in early stages of development have large growth potential. However, the potential of high earnings also comes with high risk. Small-cap companies face limited reserves, which make them more vulnerable than larger ones. Furthermore, in order to grow, they need to be able to replicate their business model on a bigger scale.
This is the sort of tradeoff investors must think about when choosing how to structure their portfolio. Typical factor models suggest that there are excess returns to be had in areas like value, relative strength, and small-cap, often at the cost of a little extra volatility. If you’re willing to take on more risk for the chance of higher returns, a portfolio that combines relative strength with small-cap stocks might be a good place to look!
Comments Off on Small-Cap Relative Strength Performance | Relative Strength Research | Tagged: cap, capitalization, etf, large, large cap, market, relative strength, small | Permalink
Posted by:
Amanda Schaible
July 3, 2012
Critics of the Efficient Markets Hypothesis continue to get more press. Newsweek’s Barrett Sheridan recently wrote an article that discusses the Efficient Markets Hypothesis (EMH) versus the adaptive-markets hypothesis (AMH). He mentions one of the key flaws in EMH: that market participants are rational.
He goes on to focus on MIT professor Andrew Lo and his AMH work. Lo does not share the EMH tenet that the financial markets consist of cool, calm, and rational investors. He suggests that investors will behave differently depending on their psychology at any given moment. (Some of the old brokers I knew called it the fear-greed pendulum.) It follows that any investment rule based on a fixed measurement of value for the market such as yield, P/E ratio, etc. will work only sporadically over time if the AMH is valid. Nothing is set in stone because investors continually change and adapt to the market ecosystem.
Our Systematic RS portfolios use relative measurements. We believe in an adaptive approach to investing that recognizes that since markets are controlled by real people, they act like real people.
—-this article originally appeared 1/5/2010. Every advisor knows that the risk tolerance of clients changes over the course of a market cycle. I still can’t figure out why anyone thinks that the Efficient Markets Hypothesis ever made sense.
Comments Off on From the Archives: Markets Act Like Real People | From the Archives, Investor Behavior, Markets, Thought Process | Tagged: adaptive, adaptive markets hypothesis, AMH, behavioral finance, efficient markets hypothesis, EMH, relative strength | Permalink
Posted by:
Mike Moody
July 3, 2012
In this post, I’ll be looking at another market indicator, the VIX, which is otherwise known as the fear index. The Chicago Board Options Exchange Market Volatility Index measures the expected market volatility over the next 30 days. When VIX is low, there is a low expectation of volatility; and when high, the opposite is true. The VIX is quoted in percentage points, and roughly correlates with the expected annualized percentage change of the S&P; 500.
Looking at monthly data starting in 1990, the VIX has ranged from about 10 at the end of January 2007 to about 60 at the end of October 2008. The highest reading ever was an intra-day high 89.53 on October, 24th 2008. In fact, 7 of the highest 10 readings have occurred since the financial crisis started in 2008.
To find returns, we’ve sorted the VIX into deciles, from lowest to highest. We then used Ken French’s high relative strength database (explained here) to determine the average percentage of growth 3, 6, and 12 months out.

Chart 1: Average Relative Strength Returns by VIX Decile.
The returns tend to have a U shape, with high returns at both extremes of the VIX. This is true when looking at all three periods (3, 6, and 12 months). Furthermore, average returns have been best when the VIX is extremely high rather than extremely low. To get some perspective, the bottom 20% of month-end readings range from 10 to 13, and the top 20% range from 25 to 60.
Even though some of the largest growth rates have occurred when the VIX is high, we must remember that most investors are risk averse and prefer low volatility. Therefore, convincing clients to invest when the VIX is high may be a daunting task. If you’d like to read more, both the VIX index and the preference for low volatility are discussed in this previous blog post.
There have been consistent relative strength return trends when looking at VIX readings over the past 22 years. If these trends continue, there may be high future returns next time the VIX hits an extreme level.
1 Comment | Investor Behavior, Relative Strength Research | Tagged: fear index, indicator, relative strength, returns, vix | Permalink
Posted by:
Amanda Schaible
June 26, 2012
Bloomberg has an article today entitled “ETFs Passive No More.” It’s an article about the rise of intelligent indexation. Here’s their thesis:
Exchange-traded funds are posing a new threat to the $7.8 trillion market for active mutual funds by challenging the notion ETFs are only good for tracking benchmarks.
Here’s their blurb about PDP:
The PowerShares DWA fund, which invests in U.S.-listed companies, uses an index that selects them based on “relative strength,” a proprietary screening methodology developed by Richmond, Virginia-based Dorsey, Wright & Associates Inc. The fund has advanced at an annual rate of 2 percent since its inception in March 2007, compared with the 1.2 percent gain for the Standard & Poor’s 500 Index over the same period, and the 3.8 percent increase in the Russell 3000 Growth Index.
Their offerings may further erode the market share of active mutual funds, sold by traditional money managers such as Fidelity Investments, Capital Group Cos. and Franklin Resources Inc. The companies tout the ability of their managers to beat benchmarks mostly through individual security selection.
“Historically, active managers held a unique appeal to prospective investors,” said Steven Bloom, who helped develop the first ETF in the 1980s and is now an assistant professor of economics at the U.S. Military Academy at West Point, New York.“Now, ETFs are infringing on that territory by holding out the prospect of alpha.”
The article points out that by using a rules-based investment process within an ETF, you can shoot for alpha, while getting the tax benefits of the ETF structure. Rules-based ETFs are going to continue to blur the line with active mutual funds over time. It’s also going to be interesting to see how many of the rules-based processes are robust and how many have been optimized. Curve-fitted performance will tend to degrade over time, while a truly adaptive model should be more consistent.
We think the trend toward intelligent indexes will continue and we’re excited to be one of the pioneers.
See www.powershares.com for more information about PDP. Past performance is no guarantee of future returns. A list of all holdings for the trailing 12 months is available upon request.
Comments Off on PDP in the News | From the MM, Media, Thought Process | Tagged: etf, PDP, relative strength, rules-based, systematic investment process, Technical Leaders | Permalink
Posted by:
Mike Moody
June 25, 2012
That’s the title of a wonderful piece from Jonathan Hoenig writing for Smart Money. It’s an excellent reminder that the market is always the final arbiter.
Think of our job not as proclaiming how the markets will act, but observing how they are acting now, and attempting to position our own portfolios to hop along the trend.
So rather than command the markets to act as we think they should, investors should instead rely on the price action to observe how they’re performing and position him/herself accordingly. Because we’re not all-knowing: not you or I or Ben Bernanke, Bill Gross, Barton Biggs or anyone else. The market doesn’t know, care or consider anything we say or do.
That humility offers a more honest and realistic context by which to evaluate our next move.
In truth, the only way to make money is to follow the price trend. Relative strength is a good way to identify the strongest trends.
Comments Off on The Market Doesn’t Follow Orders | Markets, Thought Process | Tagged: price trend, relative strength, trend following | Permalink
Posted by:
Mike Moody
June 22, 2012
Investors frequently rely on market indicators, such as moving averages, to decide when to buy, sell, or hold a stock. In fact we hear all the time of the magical powers of the moving average indicator, which has the mystical capabilities of keeping you out of trouble during market downturns, while making sure you are along for the ride on any rallies.
Therefore, we decided to test performance of Ken French’s High Relative Strength Index (an explanation of this index can be found here) against 50 and 200 day moving averages. We’ve calculated returns based on the assumption that the investor buys or holds when the price of the RS stock is above the moving average, and sells when the price drops below the moving average. So when the index is above its 50-, or 200-day moving average, we are fully invested, and when it’s below, we are out of the index.

Chart 1: Returns from 1963-2012. During this time period, basing buy and sell decisions off of the 50 day moving average is more successful than being fully invested. It is important to keep in mind that this data includes the bear markets of the 1970s and 2000s.

Chart 2: Returns from 1975-2007. When we start at a different point in time, the 50 day moving average performs much more poorly. In this dataset, we’ve cut out two large bear markets, and the effect on returns is drastic. In this case, it would have been better to just buy and hold.

Table 1: Annualized Returns by Time Periods. The average annualized returns also vary based on the period of time measured. At certain times, following moving averages outperforms being fully invested; but in other periods the opposite is true. Check out the difference between the two periods of ’83-’00 and ’66-’82. Using a moving average can either make or break your returns.


Charts 3 and 4: Fully Invested Ken French – Use of 50 Day MA (5 and 10 Year Performance). Investment performance based on moving averages varies greatly over time. In some periods, it performs incredibly, while in others it does terribly.
The performance of moving average based investment is directly related to the time period in which it is measured. As shown in Table 1, the returns can be completely different even in periods that partially overlap. The question then becomes not whether or not to use a moving average, but when! If you can predict the future, you’ll easily be able to decide whether or not to use a moving average when holding an index.
5 Comments | Relative Strength Research | Tagged: 200 day, 50 day, buy-and-hold, moving average, performance, relative strength, s&p500, stock market | Permalink
Posted by:
Amanda Schaible
June 20, 2012
The Journal of Indexes has the entire current issue devoted to articles on this topic, along with the best magazine cover ever. (Since it is, after all, the Journal of Indexes, you can probably guess how they came out on the active versus passive debate!)
One article by Craig Israelson, a finance professor at Brigham Young University, stood out. He discussed what he called “actively passive” portfolios, where a number of passive indexes are managed in an active way. (Both of the mutual funds that we sub-advise and our Global Macro separate account are essentially done this way, as we are using ETFs as the investment vehicles.) With a mix of seven asset classes, he looks at a variety of scenarios for being actively passive: perfectly good timing, perfectly poor timing, average timing, random timing, momentum, mean reversion, buying laggards, and annual rebalancing with various portfolio blends. I’ve clipped one of the tables from the paper below so that you can see the various outcomes:

Click to enlarge
Although there is only a slight mention of it in the article, the momentum portfolio (you would know it as relative strength) swamps everything but perfect market timing, with a terminal value more than 3X the next best strategy. Obviously, when it is well-executed, a relative strength strategy can add a lot of return. (The rebalancing also seemed to help a little bit over time and reduced the volatility.)
Maybe for Joe Retail Investor, who can’t control his emotions and/or his impulsive trading, asset allocation and rebalancing is the way to go, but if you have any kind of reasonable systematic process and you are after returns, the data show pretty clearly that relative strength should be the preferred strategy.
—-this article originally appeared 1/8/2010. Relative strength rocks.
1 Comment | From the Archives, From the MM, Markets, Relative Strength Research, Tactical Asset Alloc, Thought Process | Tagged: asset allocation, buy-and-hold, momentum, rebalancing, relative strength, systematic investment process, Tactical Asset Allocation | Permalink
Posted by:
Mike Moody
June 19, 2012
Aswath Damodaran wrote the book on valuation, literally. He is a valuation guru, or as close to it as you are going to find. He readily admits that valuation is a biased process. From Business Insider:
Something that Aswath Damodaran reiterated frequently during his lecture is that valuation is not some sort of magical, objective science that will let you know what others don’t. It provides an anchor for your thinking and investment behavior.
Here are the three biggest myths of valuation from Professor Damodaran’s presentation:
- A valuation is an objective search for true value
- A good valuation provides a precise estimate of value
- The more quantitative a model, the better the valuation
Here’s the anecdote Professor Damodaran told to illustrate the first point:
“I have valued Microsoft every year since 1986, the year of their IPO. 26 years in a row. Every year through 2011 when I valued Microsoft I found it to be overvalued. You name the price, I found it overvalued. $2, $4, $8, “don’t buy, don’t buy, don’t buy.” Strange right? One of the great success stories of US equity markets over the last 50 years, and I wouldn’t have touched it one step of the way. Now I can give you access to every one of those models… You can dig through these models looking for clues as to why I found Microsoft to be overvalued, but you’d be looking in the wrong place. If you really want to know why I found Microsoft to be overvalued all of these years, all you need to do is walk up my office and look around. What you’re going to see is a bunch of computers with fruits on the back.”
Although there are multiple ways in which relative strength can be calculated, all investors using the same method are going to get the same result. There is no subjectivity in terms of assumptions and inputs. That kind of objectivity can really help eliminate emotions and biases from the investment process. To take Damodaran’s example, if Microsoft qualifies as one of the great success stories of the past 50 years, it would have had high relative strength somewhere along the line, by definition. End of story.
1 Comment | Investor Behavior, Markets, Thought Process | Tagged: relative strength, systematic investment process, value investing | Permalink
Posted by:
Mike Moody
June 13, 2012
Man versus machine, art versus science, intuition versus logic—all of these are ways of expressing what we often think of as contradictory approaches to problem solving. Should we be guided more by data and precedent, or is it more important to allow for the human element? Is it critical to be able to step aside and say, with the benefit of our judgment, “maybe this time really is different?”
The Harvard Business Review recently took on this topic and a few of their points were quite provocative.
A huge body of research has clarified much about how intuition works, and how it doesn’t. Here’s some of what we’ve learned:
- It takes a long time to build good intuition. Chess players, for example, need 10 years of dedicated study and competition to assemble a sufficient mental repertoire of board patterns.
- Intuition only works well in specific environments, ones that provide a person with good cues and rapid feedback . Cues are accurate indications about what’s going to happen next. They exist in poker and firefighting, but not in, say, stock markets. Despite what chartists think, it’s impossible to build good intuition about future market moves because no publicly available information provides good cues about later stock movements. [Needless to say, I don’t agree with his assessment of stock charts!] Feedback from the environment is information about what worked and what didn’t. It exists in neonatal ICUs because babies stay there for a while. It’s hard, though, to build medical intuition about conditions that change after the patient has left the care environment, since there’s no feedback loop.
- We apply intuition inconsistently. Even experts are inconsistent. One study determined what criteria clinical psychologists used to diagnose their patients, and then created simple models based on these criteria. Then, the researchers presented the doctors with new patients to diagnose and also diagnosed those new patients with their models. The models did a better job diagnosing the new cases than did the humans whose knowledge was used to build them. The best explanation for this is that people applied what they knew inconsistently — their intuition varied. Models, though, don’t have intuition.
- We can’t know or tell where our ideas come from. There’s no way for even an experienced person to know if a spontaneous idea is the result of legitimate expert intuition or of a pernicious bias. In other words, we have lousy intuition about our intuition.
- It’s easy to make bad judgments quickly. We have many biases that lead us astray when making assessments. Here’s just one example. If I ask a group of people “Is the average price of German cars more or less than $100,000?” and then ask them to estimate the average price of German cars, they’ll “anchor” around BMWs and other high-end makes when estimating. If I ask a parallel group the same two questions but say “more or less than $30,000″ instead, they’ll anchor around VWs and give a much lower estimate. How much lower? About $35,000 on average, or half the difference in the two anchor prices. How information is presented affects what we think.
We’ve written before about how long it takes to become world-class. Most studies show that it takes about ten years to become an expert if you apply yourself diligently. Obviously, the “intuition” of an expert is much better than the intuition of a neophyte. If you think about that for a minute, it’s pretty clear that intuition is really just judgment in disguise. The expert is better than the novice simply because they have a bigger knowledge base and more experience.
Really, the art versus science debate is over and the machines have won it going away. Nowhere is this more apparent than in chess. Chess is an incredibly complex mental activity. Humans study with top trainers for a decade to achieve excellence. There is no question that training and practice can cause a player to improve hugely, but it is still no contest. As processing power and programming experience has become more widespread, a $50 CD-ROM off-the-shelf piece of software can defeat the best players in the world in a match without much problem. Most of the world’s top grandmasters now use chess software to train with and to check their ideas. (In fact, so do average players since the software is so cheap and ubiquitous.)
How did we get to this state of affairs? Well, the software now incorporates the experience and judgment of many top players. Their combined knowledge is much more than any one person can absorb in a lifetime. In addition, the processing speed of a standard desktop computer is now so fast that no human can keep it with it. It doesn’t get tired, upset, nervous, or bored. Basically, you have the best of both worlds—lifetimes of human talent and experience applied with relentless discipline.
A 2000 paper on clinical versus mechanical prediction by Grove, Zald, Lebow, Snitz, & Nelson had the following abstract:
>The process of making judgments and decisions requires a method for combining data. To compare the accuracy of clinical and mechanical (formal, statistical) data-combination techniques, we performed a meta-analysis on studies of human health and behavior. On average, mechanical-prediction techniques were about 10% more accurate than clinical predictions. Depending on the specific analysis, mechanical prediction substantially outperformed clinical prediction in 33%–47% of studies examined. Although clinical predictions were often as accurate as mechanical predictions, in only a few studies (6%–16%) were they substantially more accurate. Superiority for mechanical-prediction techniques was consistent, regardless of the judgment task, type of judges, judges’ amounts of experience, or the types of data being combined. Clinical predictions performed relatively less well when predictors included clinical interview data. These data indicate that mechanical predictions of human behaviors are equal or superior to clinical prediction methods for a wide range of circumstances.
That’s a 33-47% win rate for the scientists and a 6-16% win rate for the artists, and that was ten years ago. That’s not really very surprising. Science is what has allowed us to develop large-scale agriculture, industrialize, and build a modern society. Science and technology are not without their problems, but if the artists have stayed in charge we might still be living in caves, although no doubt we would have some pretty awesome cave paintings.
This is the thought process behind our Systematic Relative Strength accounts. We were able to codify our own best judgment, include lifetimes of other experience from investors we interviewed or relative strength studies that we examined, and have it all run in a disciplined fashion. We chose relative strength because it was the best-performing factor and also because, since it is relative, it is adaptive. There is always cooperation between man and machine in our process, but moving more toward data-driven decisions is indeed the future of decision making.
—-this article originally appeared 1/15/2010. Our thought process hasn’t changed—we still believe that a systematic, adaptive investment process is the way to go.
2 Comments | From the Archives, From the MM, Thought Process | Tagged: decision-making, relative strength, systematic investment process | Permalink
Posted by:
Mike Moody
June 12, 2012
Crosshairs Trader has an excerpt from Jack Schwager’s Hedge Fund Market Wizards. The interview with Steve Clark makes an interesting point.
Schwager: You have seen a lot of traders. What are the characteristics of traders who succeed?
Clark: They all work hard. Nearly all the successful traders I know are one-trick ponies. They do one thing, and they do it very well.
I find it interesting that most successful traders specialize in one method or return factor. The takeaway is that it is almost impossible to be an expert at everything.
Although I wouldn’t rule out expanding our expertise at some point, relative strength has always been our focus. It’s an incredible bonus that relative strength is so adaptive that it can be used in many different systematic processes.
(By the way, you’re missing a treat if you haven’t read any of Jack Schwager’s books. I haven’t read the most recent one yet, but his first Market Wizards book is one of my all-time favorites.)

One-Trick Pony
Source: dgdesignnetwork (click on image to enlarge)
HT to Abnormal Returns
Comments Off on One-Trick Pony | Thought Process | Tagged: one-trick pony, relative strength, return factor, systematic investment process | Permalink
Posted by:
Mike Moody
June 12, 2012
In past posts (“Relative Strength vs. Value-Performance over Time” and “Relative Strength, Decade by Decade”), I’ve used the Ken French database’s relative strength portfolio. While this is useful in concept, what solidifies the findings in my previous posts is the similarity between Ken French’s High RS data and one of our ETFs, PDP.
PDP is a PowerShares ETF based on the Dorsey Wright Technical Leaders Index. It has its own proprietary calculation method, which is different than that of the Ken French database. Yet, over the past five years, both have performed very similarly.
Table 1:

PDP has only been on the market since March of 2007. Yet, over those five years, the two indexes have performed almost exactly the same…no small feat considering the stock market over the last few years. Imagine, then, using the Ken French data as a “loose proxy” for PDP going back decades. We’re not saying the two will always perform the same—we’re just pointing out that it’s clear both indexes are exploiting the same factor (RS) in a practical way.
Currently, relative strength growth rates (10-year rolling returns) are at some of the lowest levels since the 1930s; and historically we can see that growth rates often increase once they hit rock bottom. That may bode well for relative strength returns going forward.
Chart 1:

See www.powershares.com for more information about PDP. Past performance is no guarantee of future returns. A list of all holdings for the trailing 12 months is available upon request.
2 Comments | Markets, Relative Strength Research | Tagged: index, PDP, relative strength, return factors, stock market | Permalink
Posted by:
Amanda Schaible


